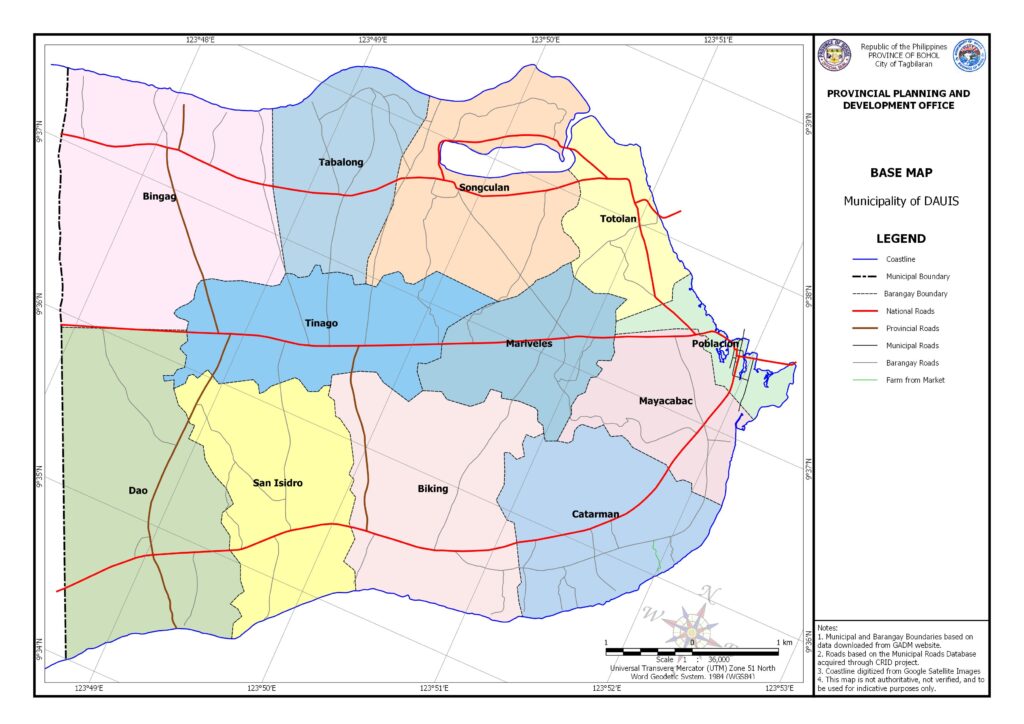
| Location | : | Southwestern part of Bohol |
| Congressional District | : | 1st District |
| Number of Barangays | : | 12 Barangays (8 coastal and 4 inland barangays) |
| Income Classification | : | 5th( Per D.O. 24-97 ) |
| Ave. LGU Annual Income | : | P51,980,388.00 |
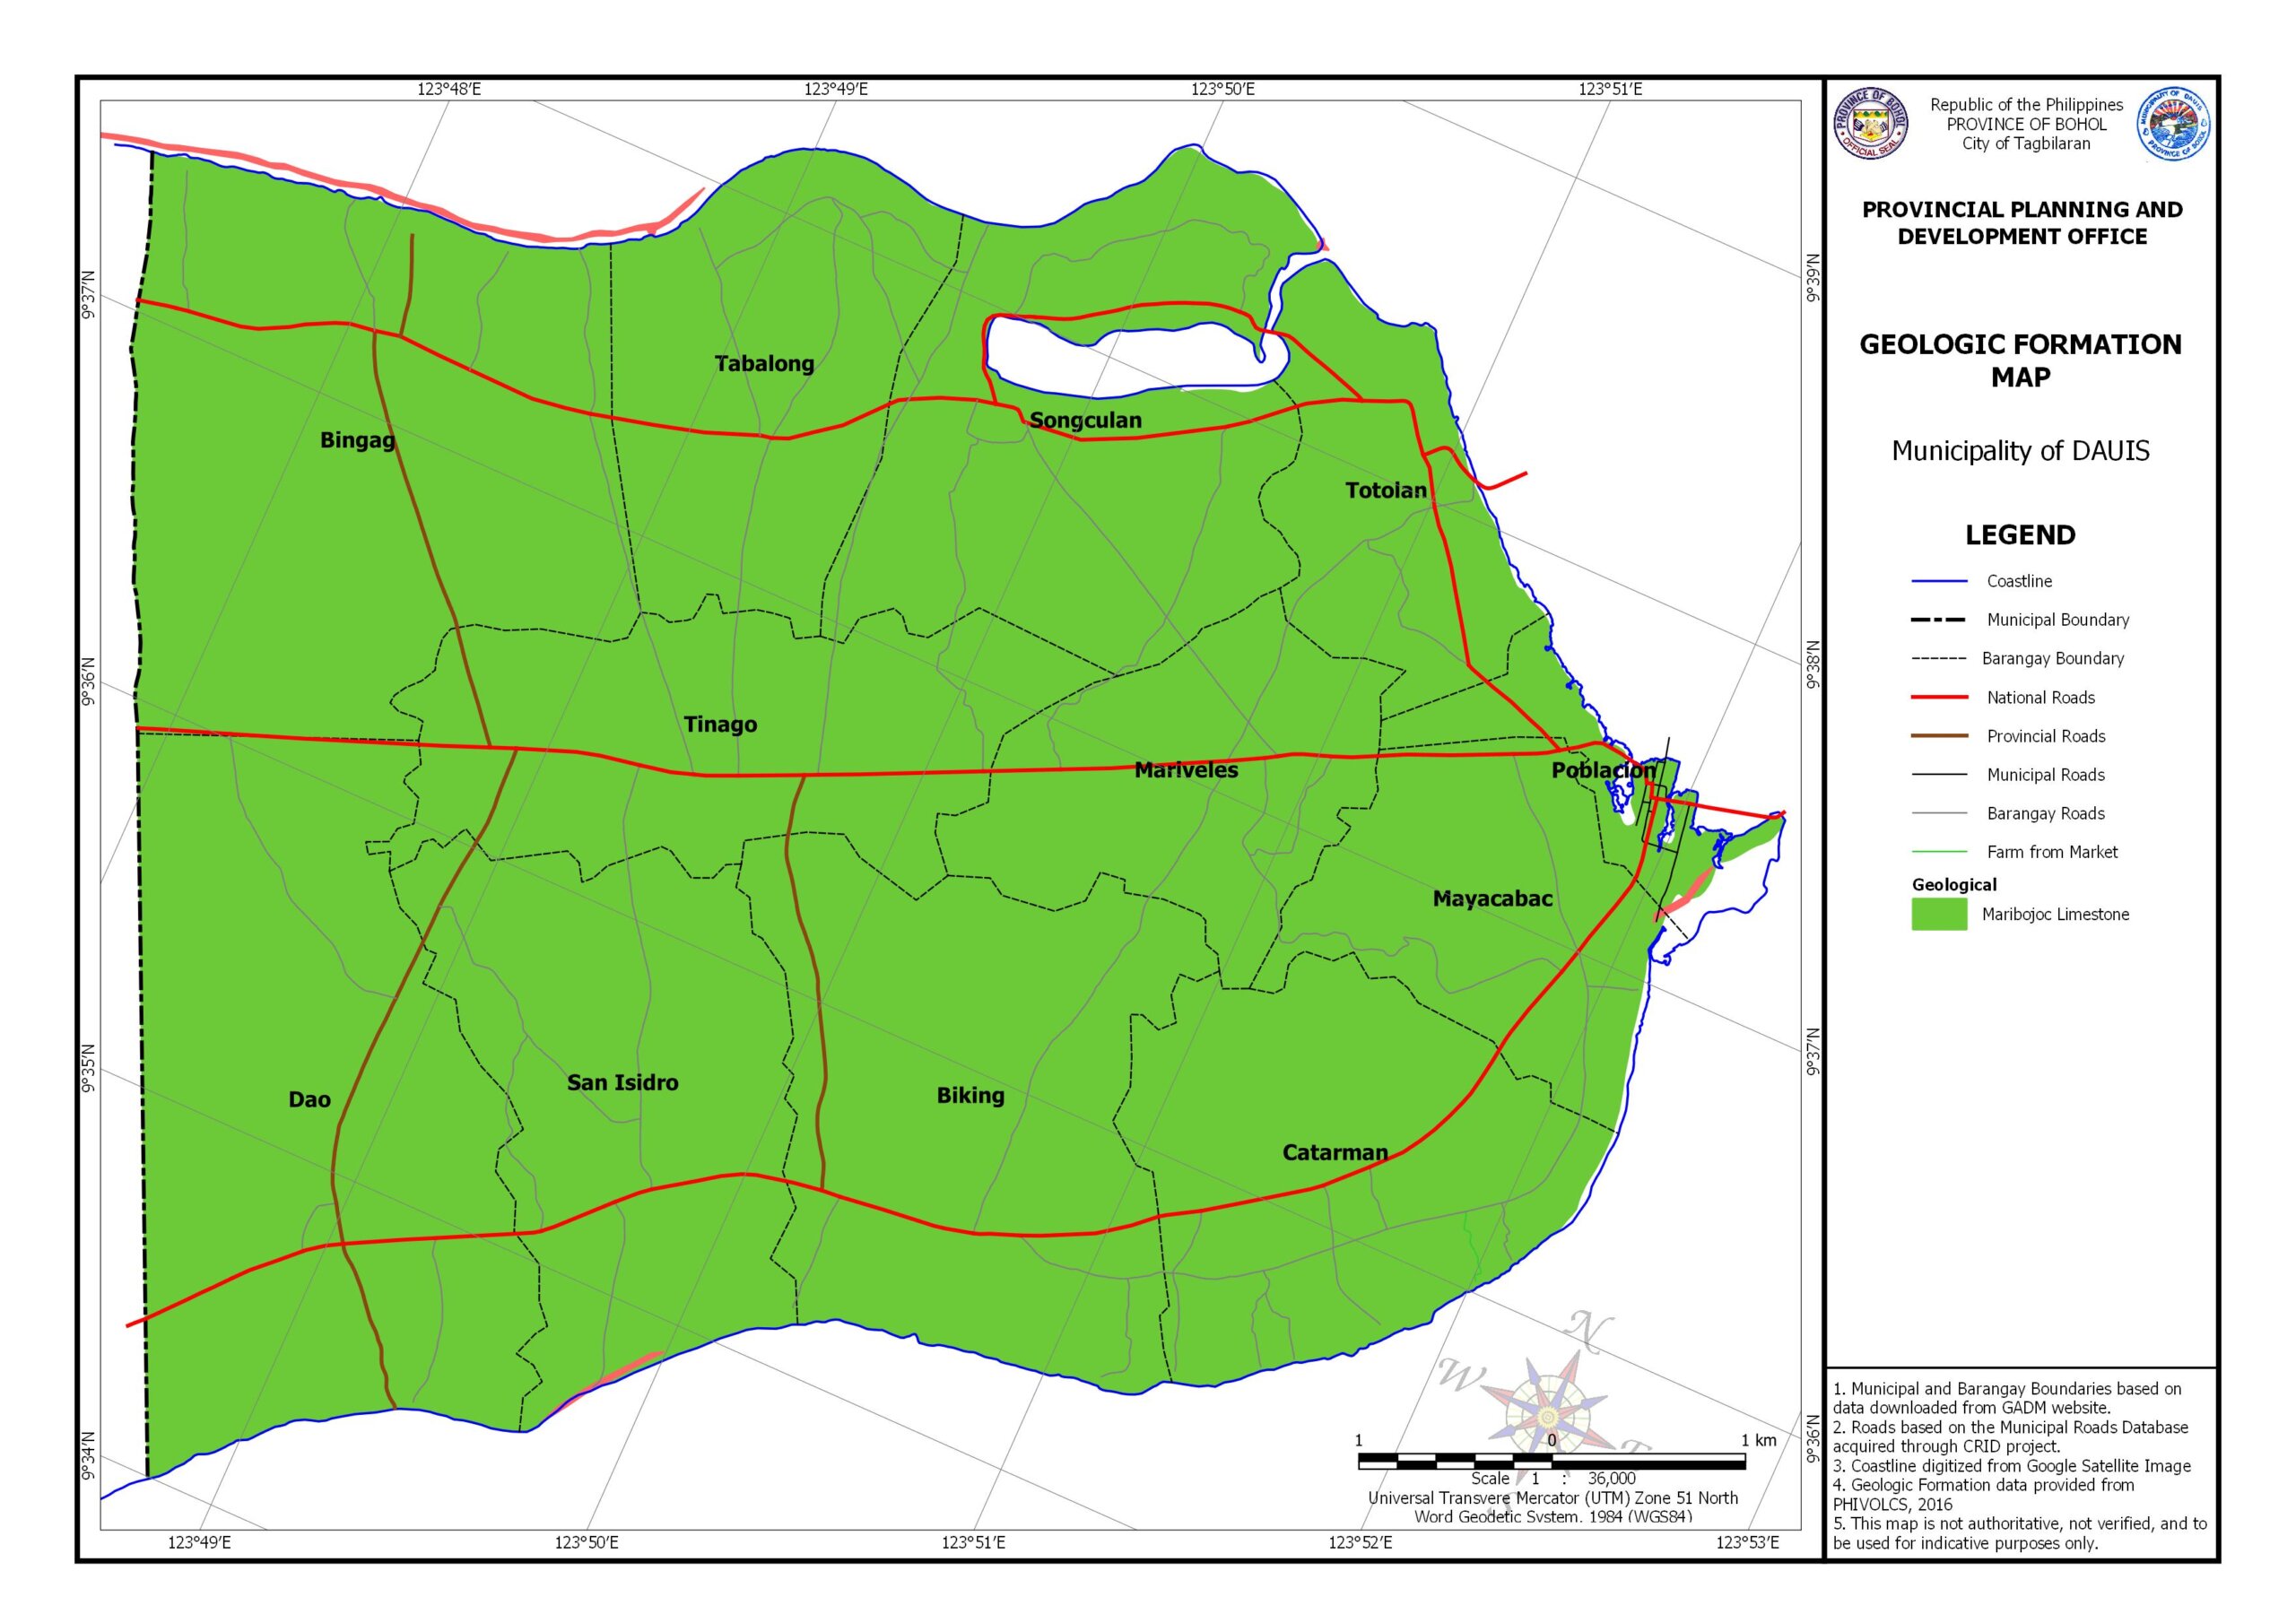
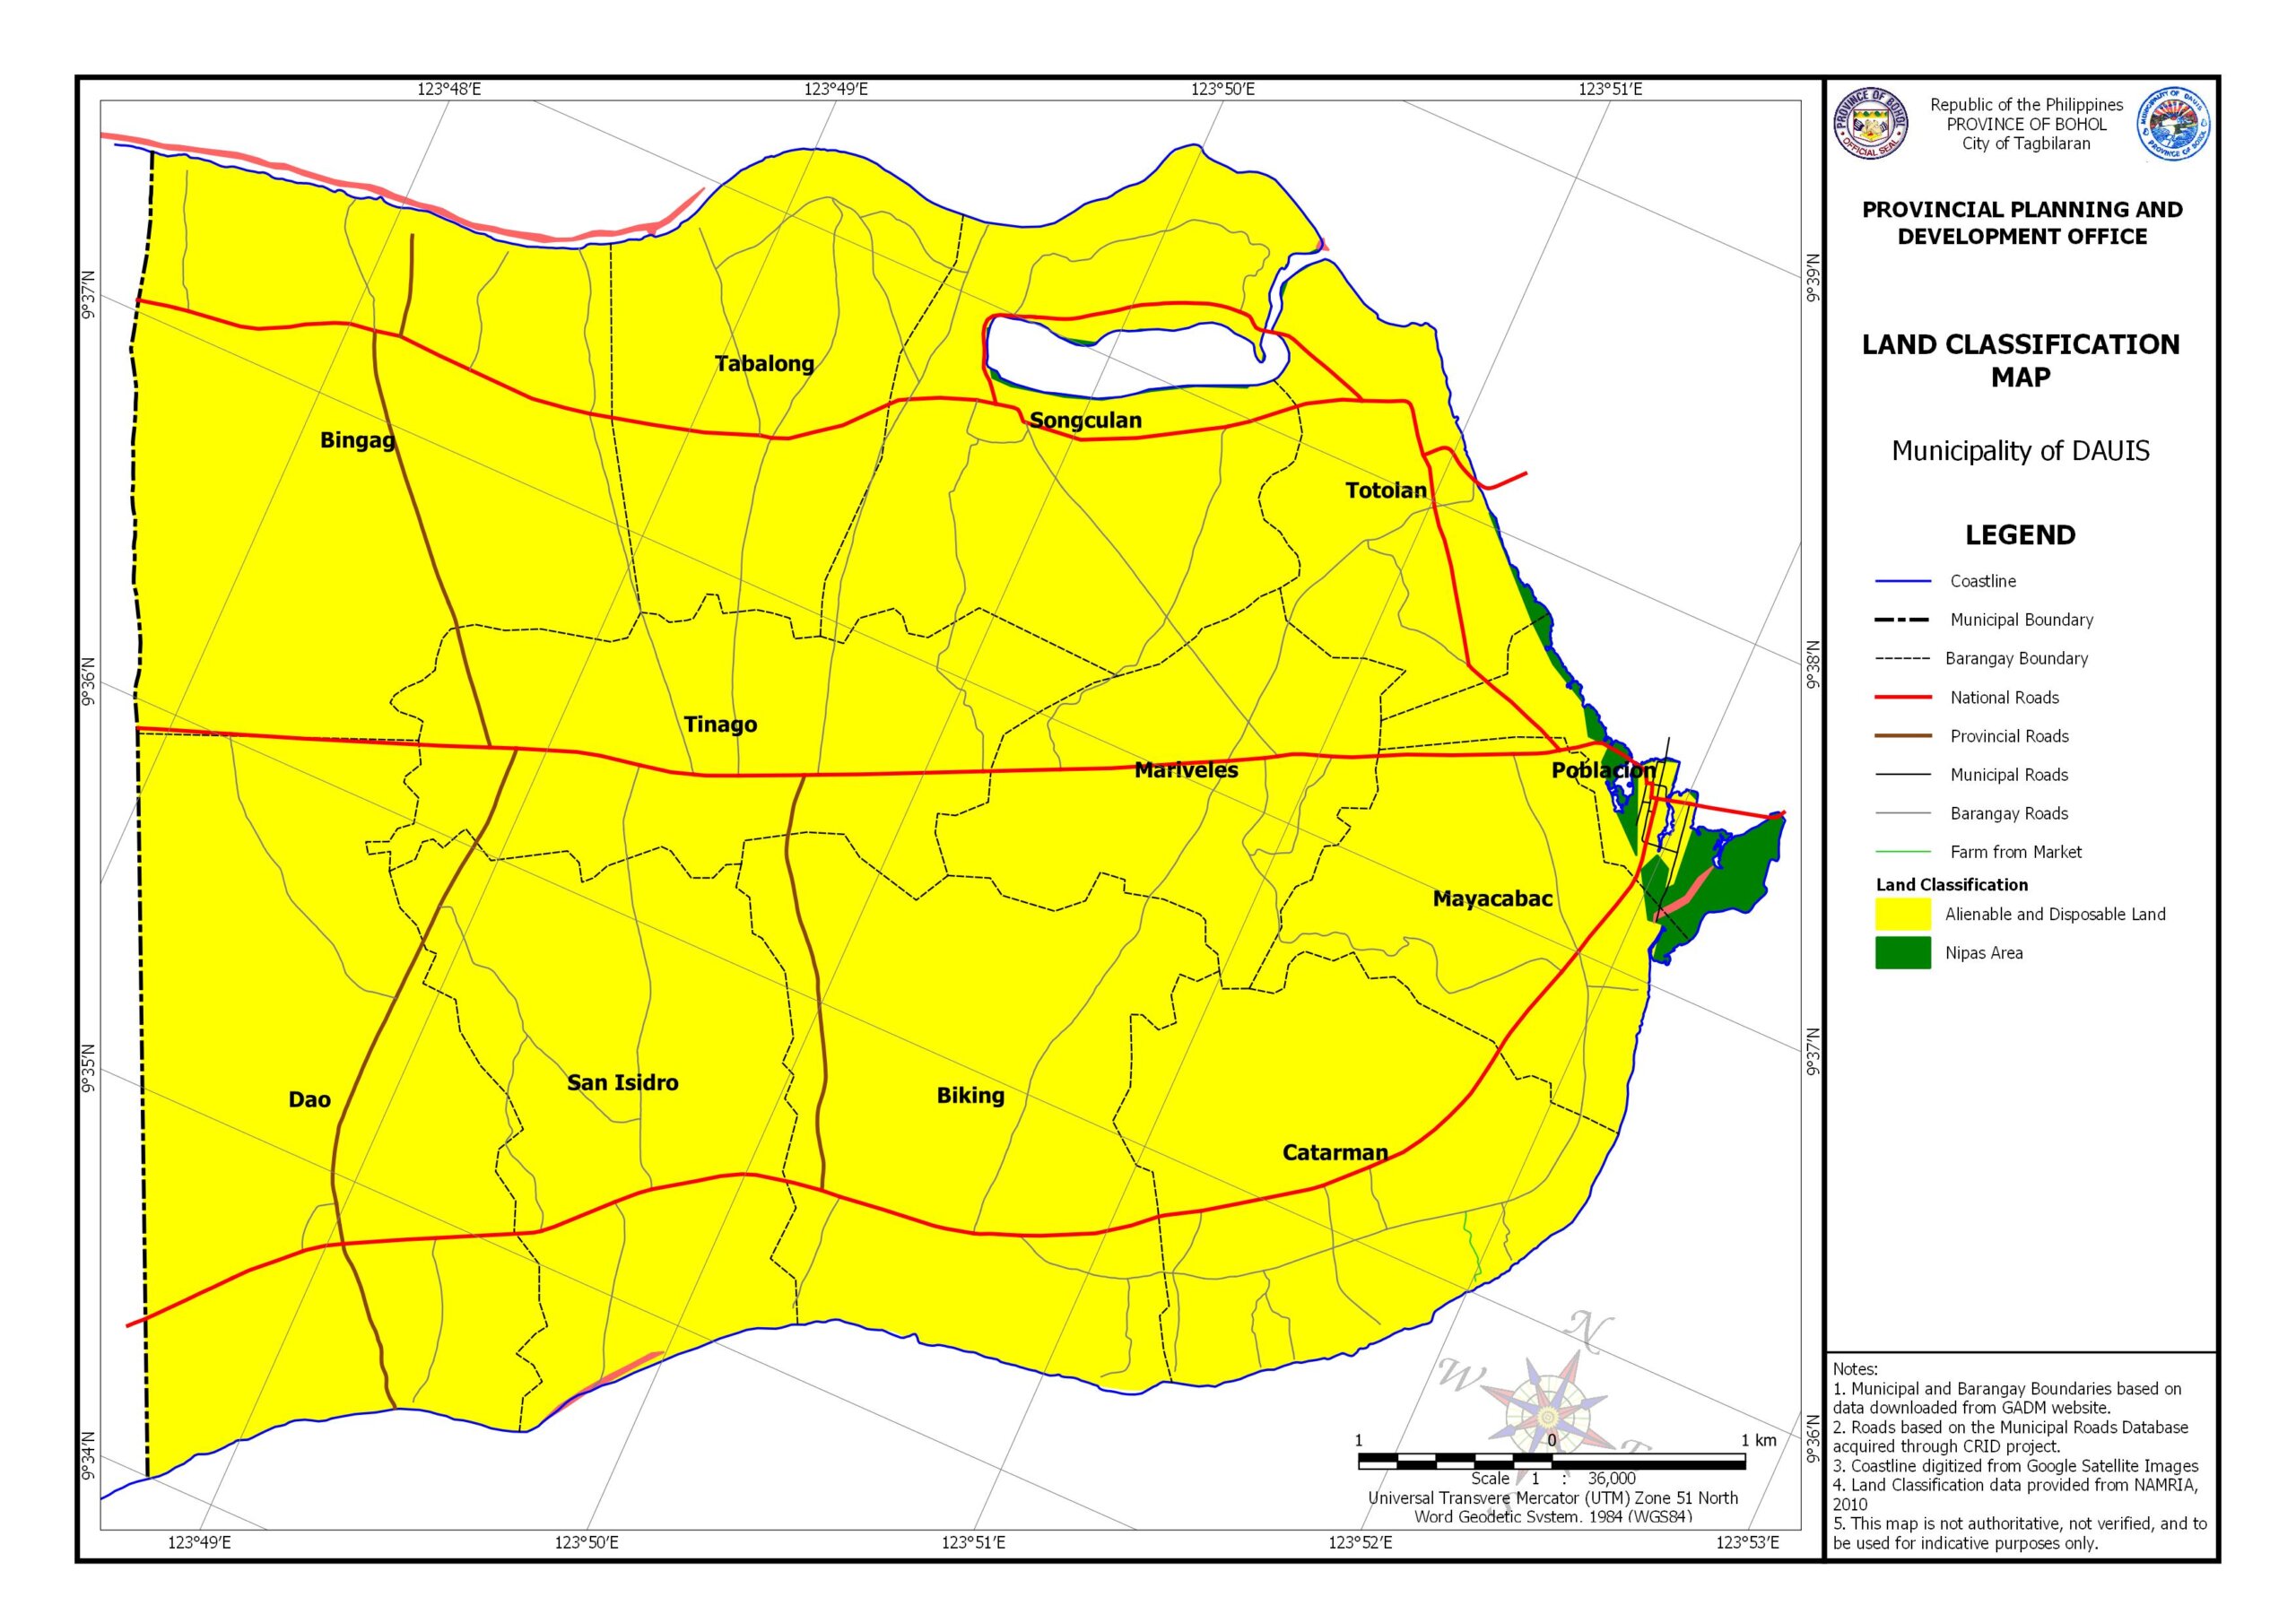
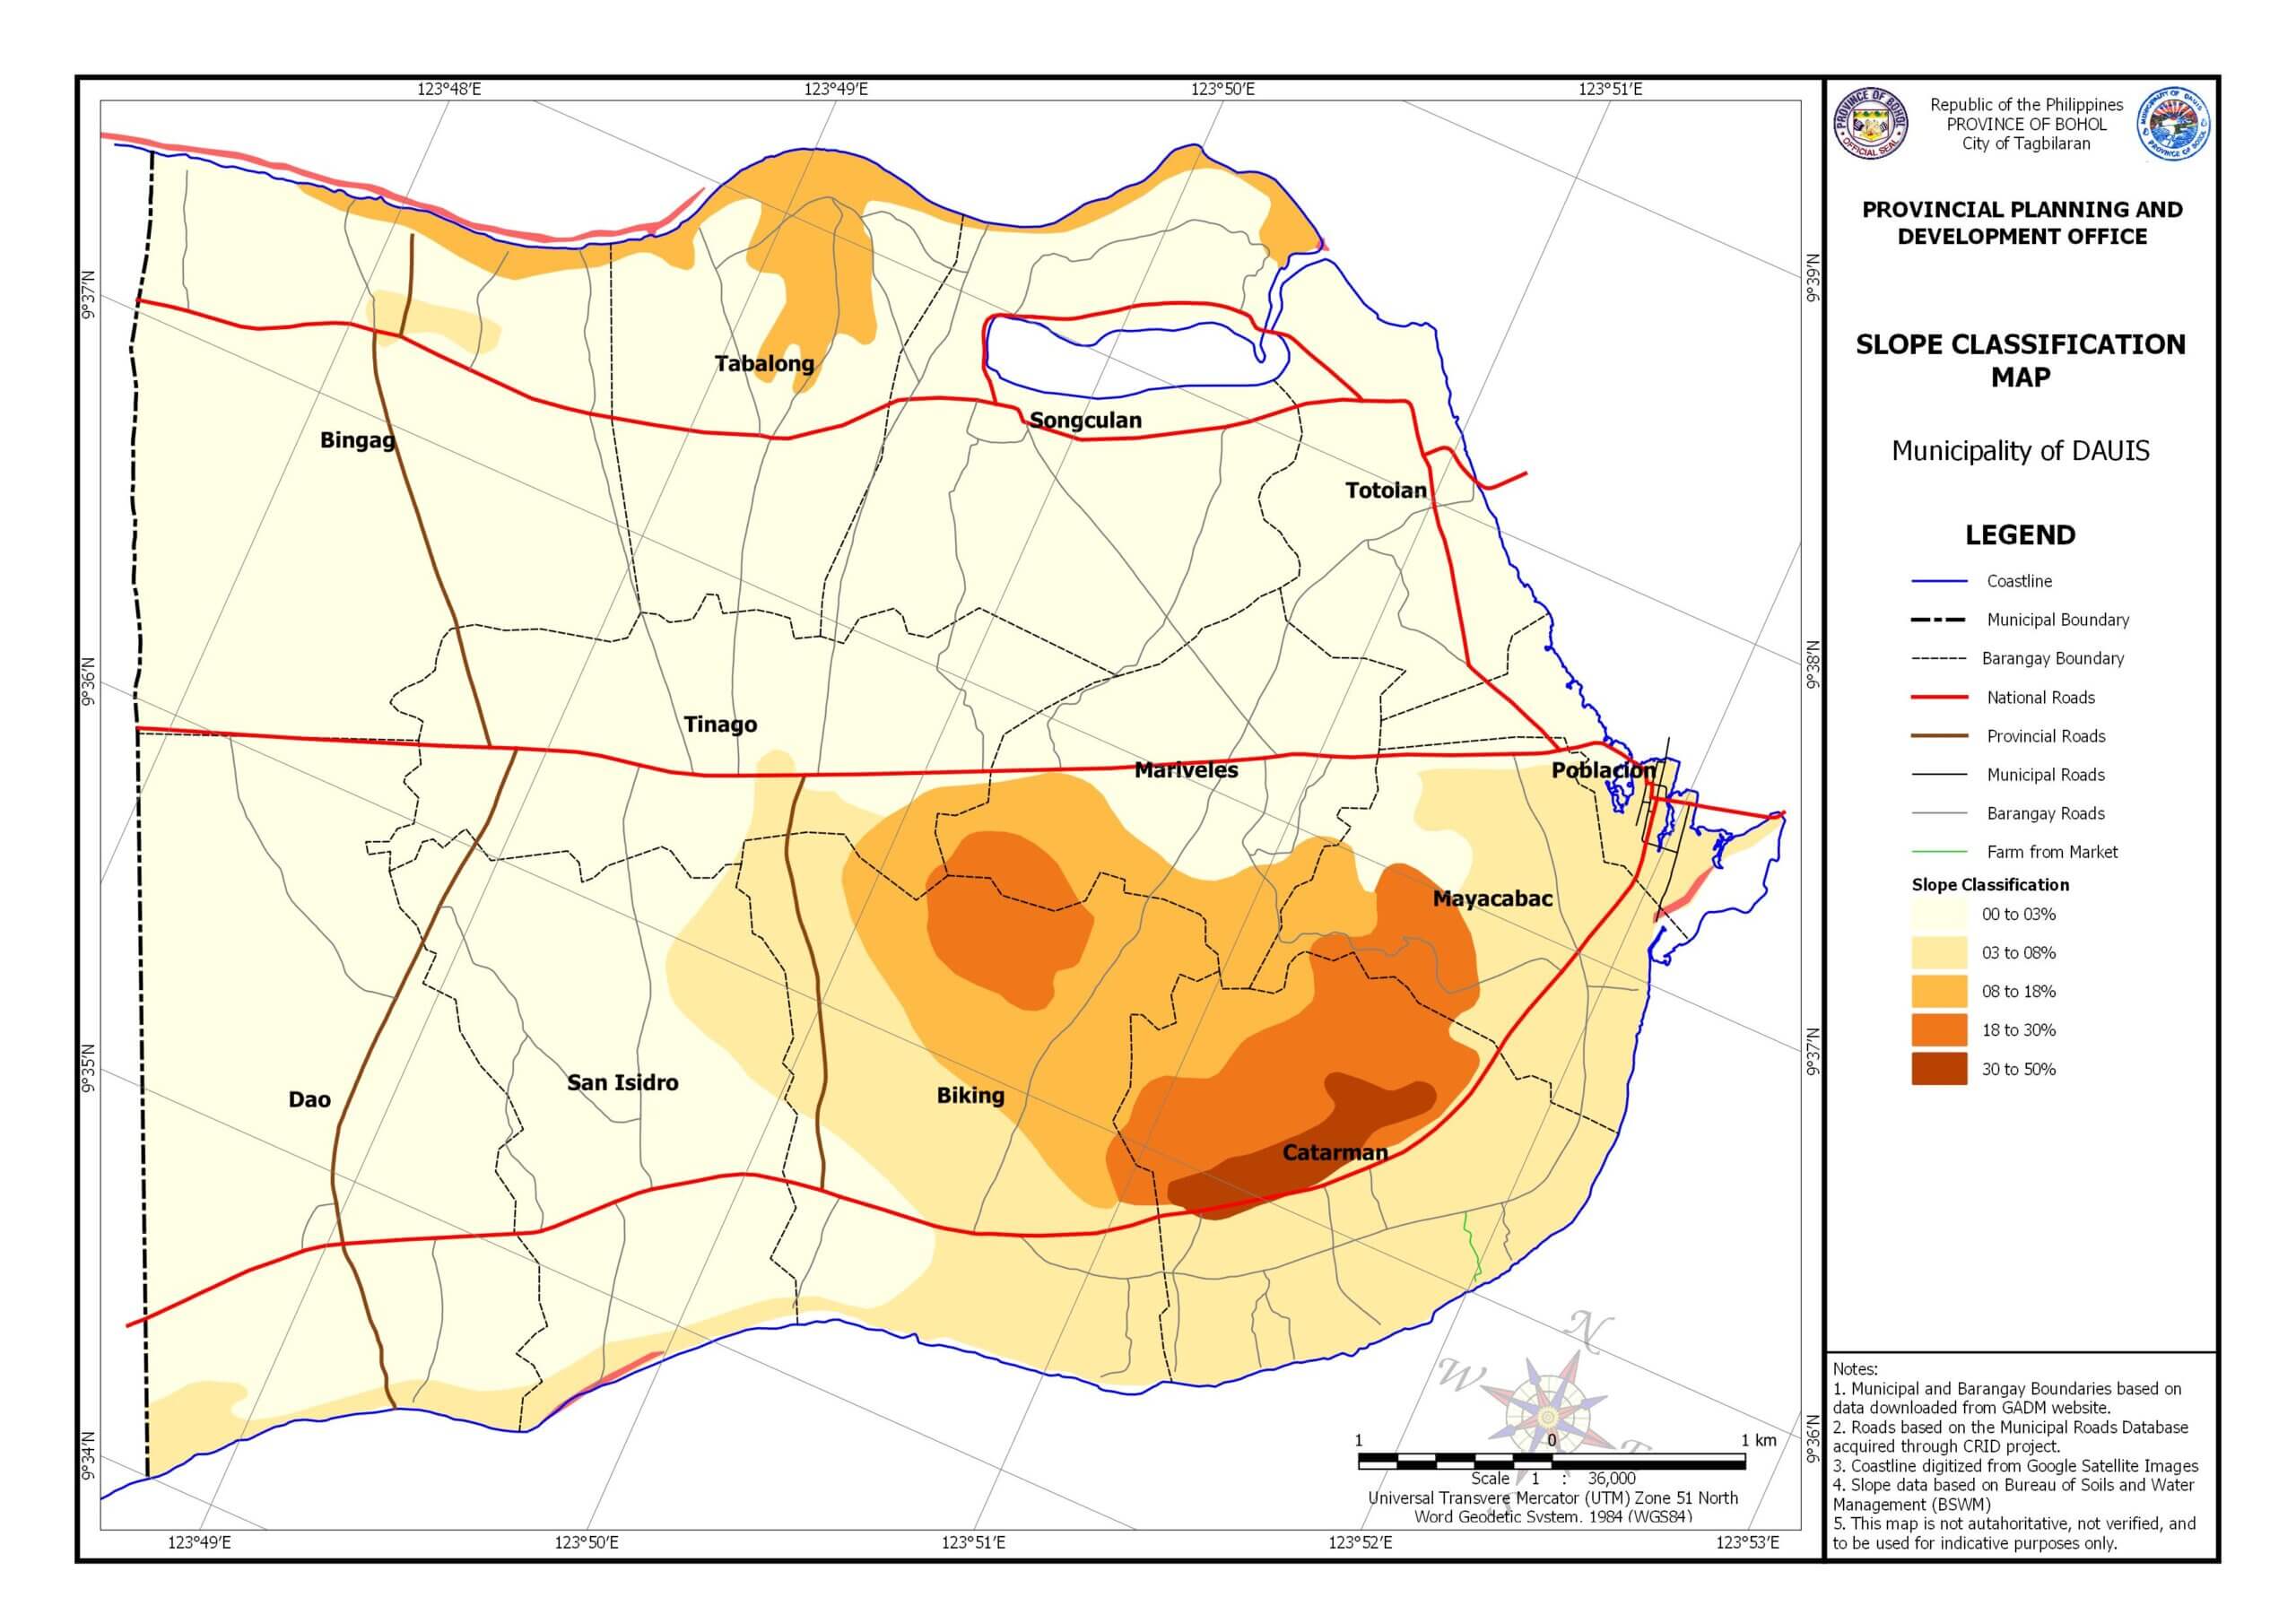
| Total Municipal Land Area | : | 4,524 hectares |
| Timberland Area | : | 25 hectares |
| Alienable & Disposable (A & D) | : | 4,499 hectares |
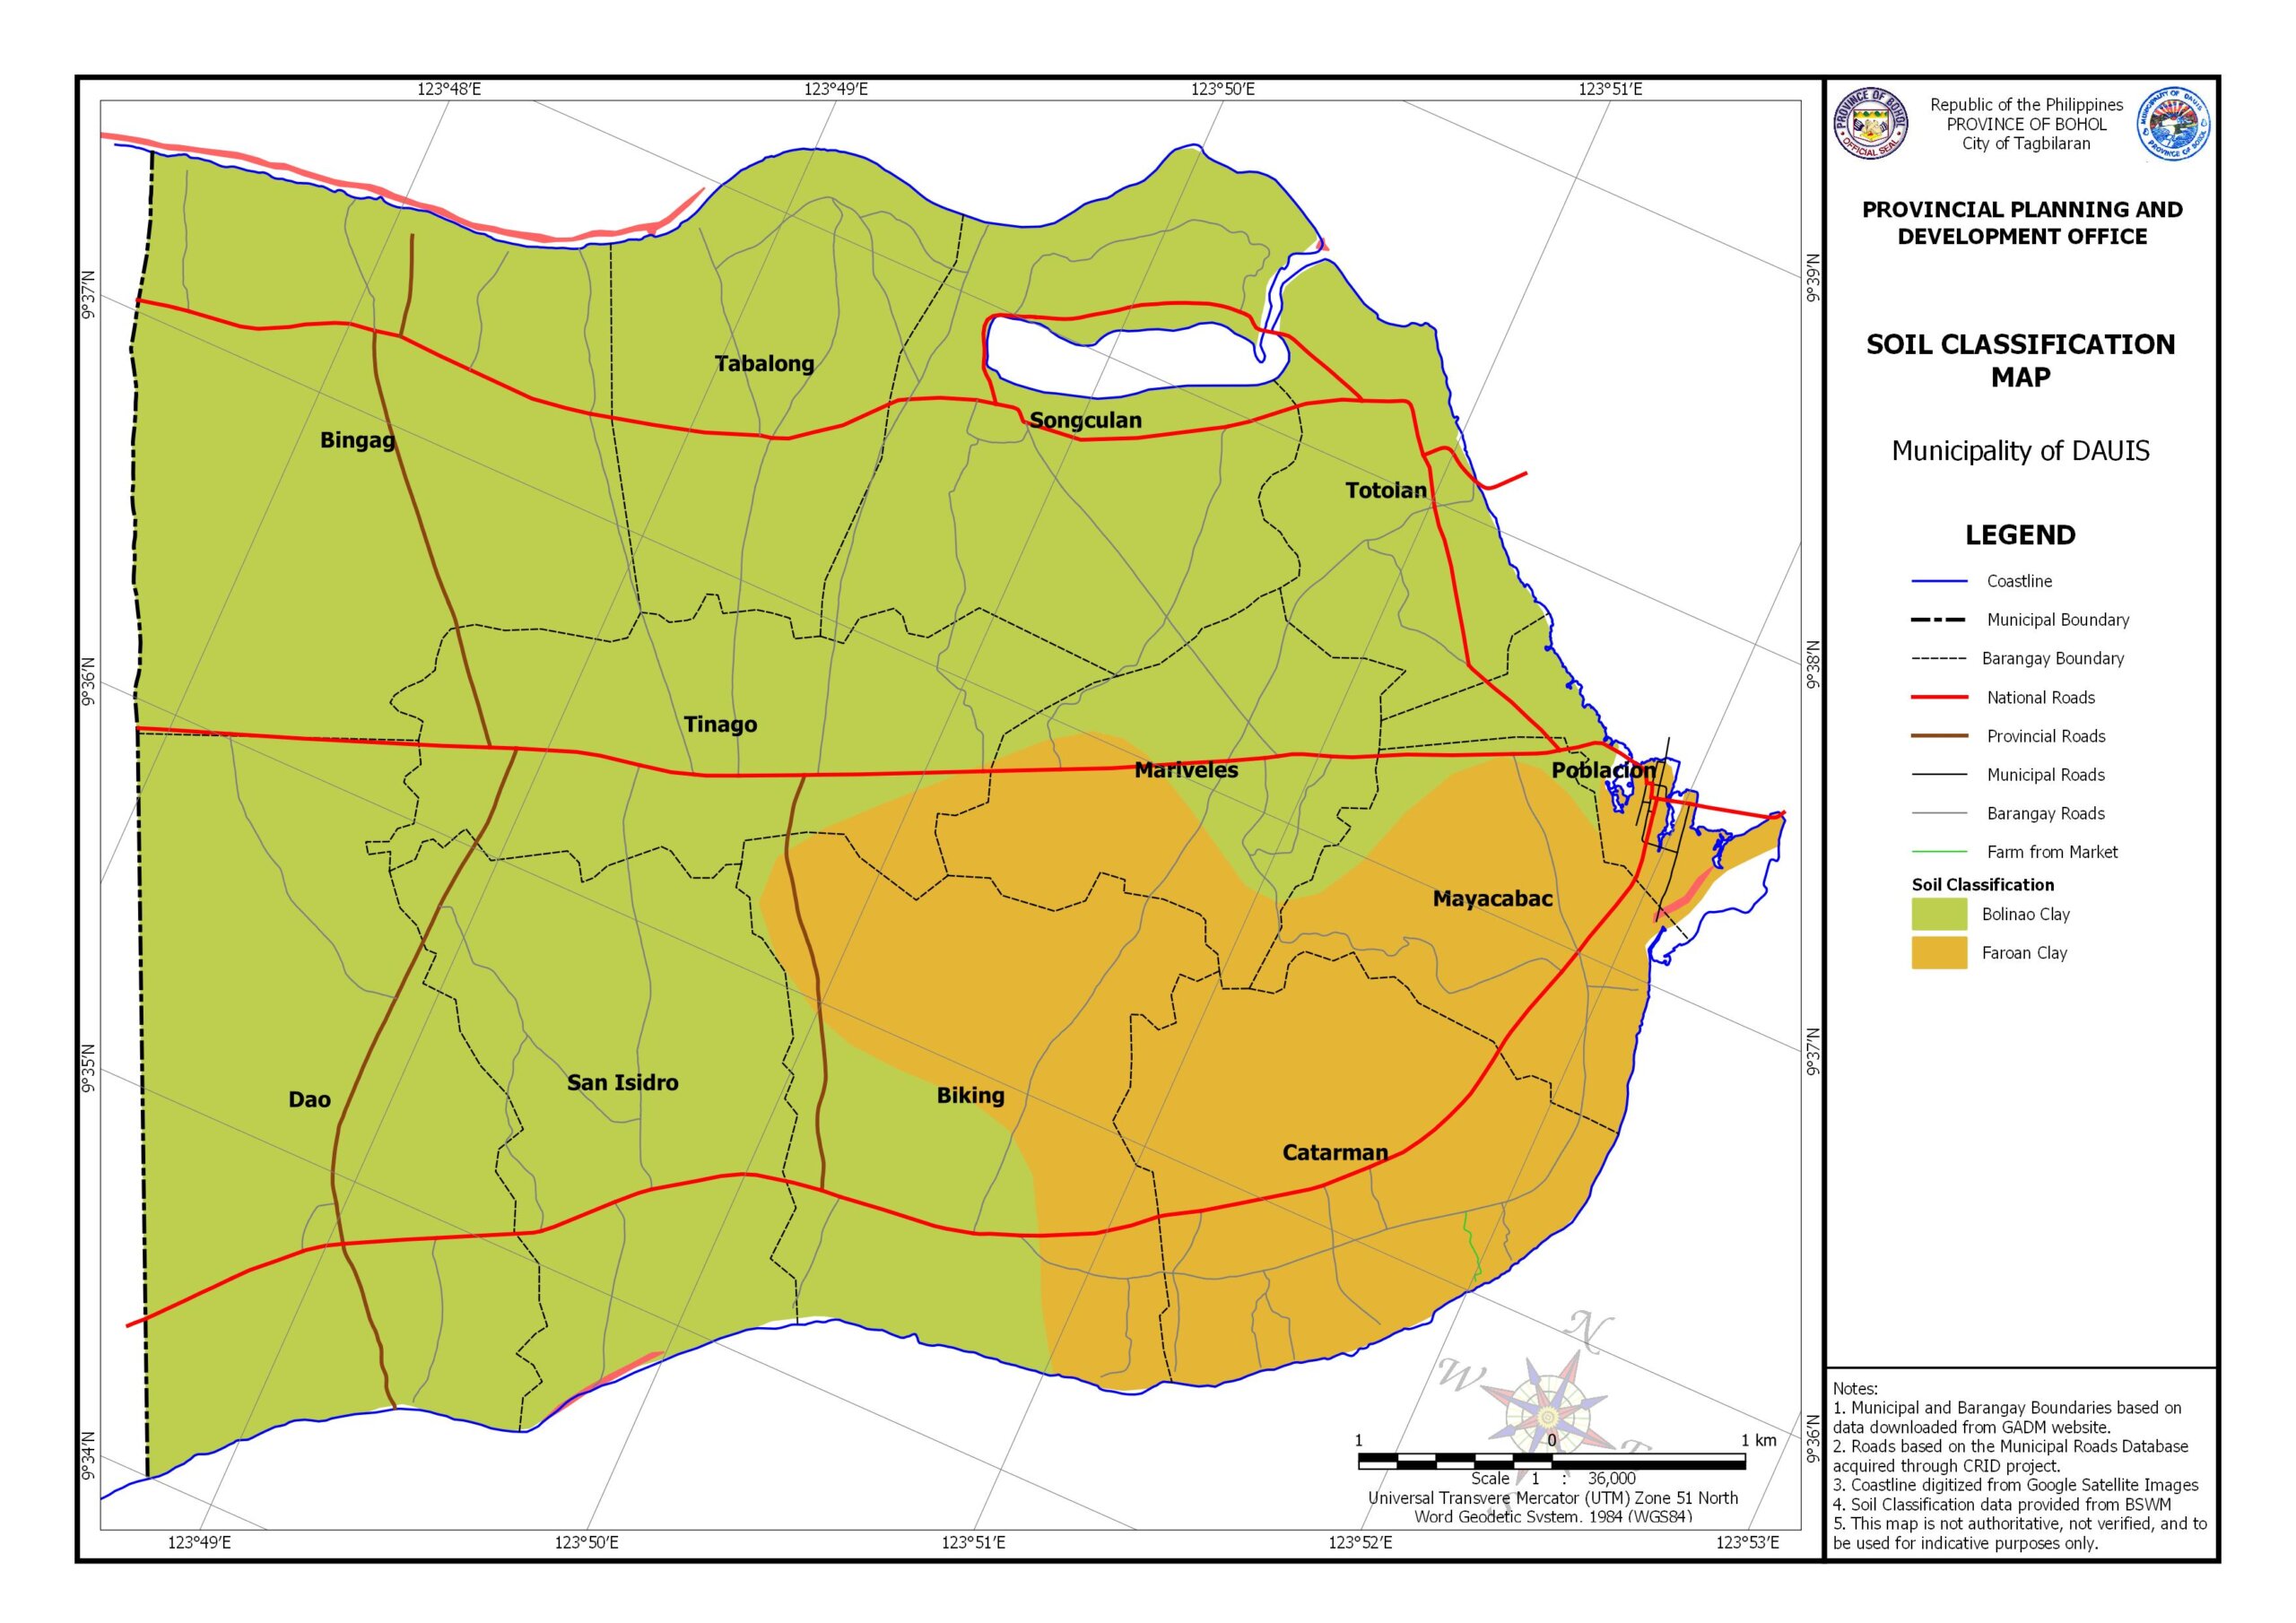
| Soil Cover | : | Bolinao Clay |
| River Basins (Watershed Areas) | : | Panglao Is. |
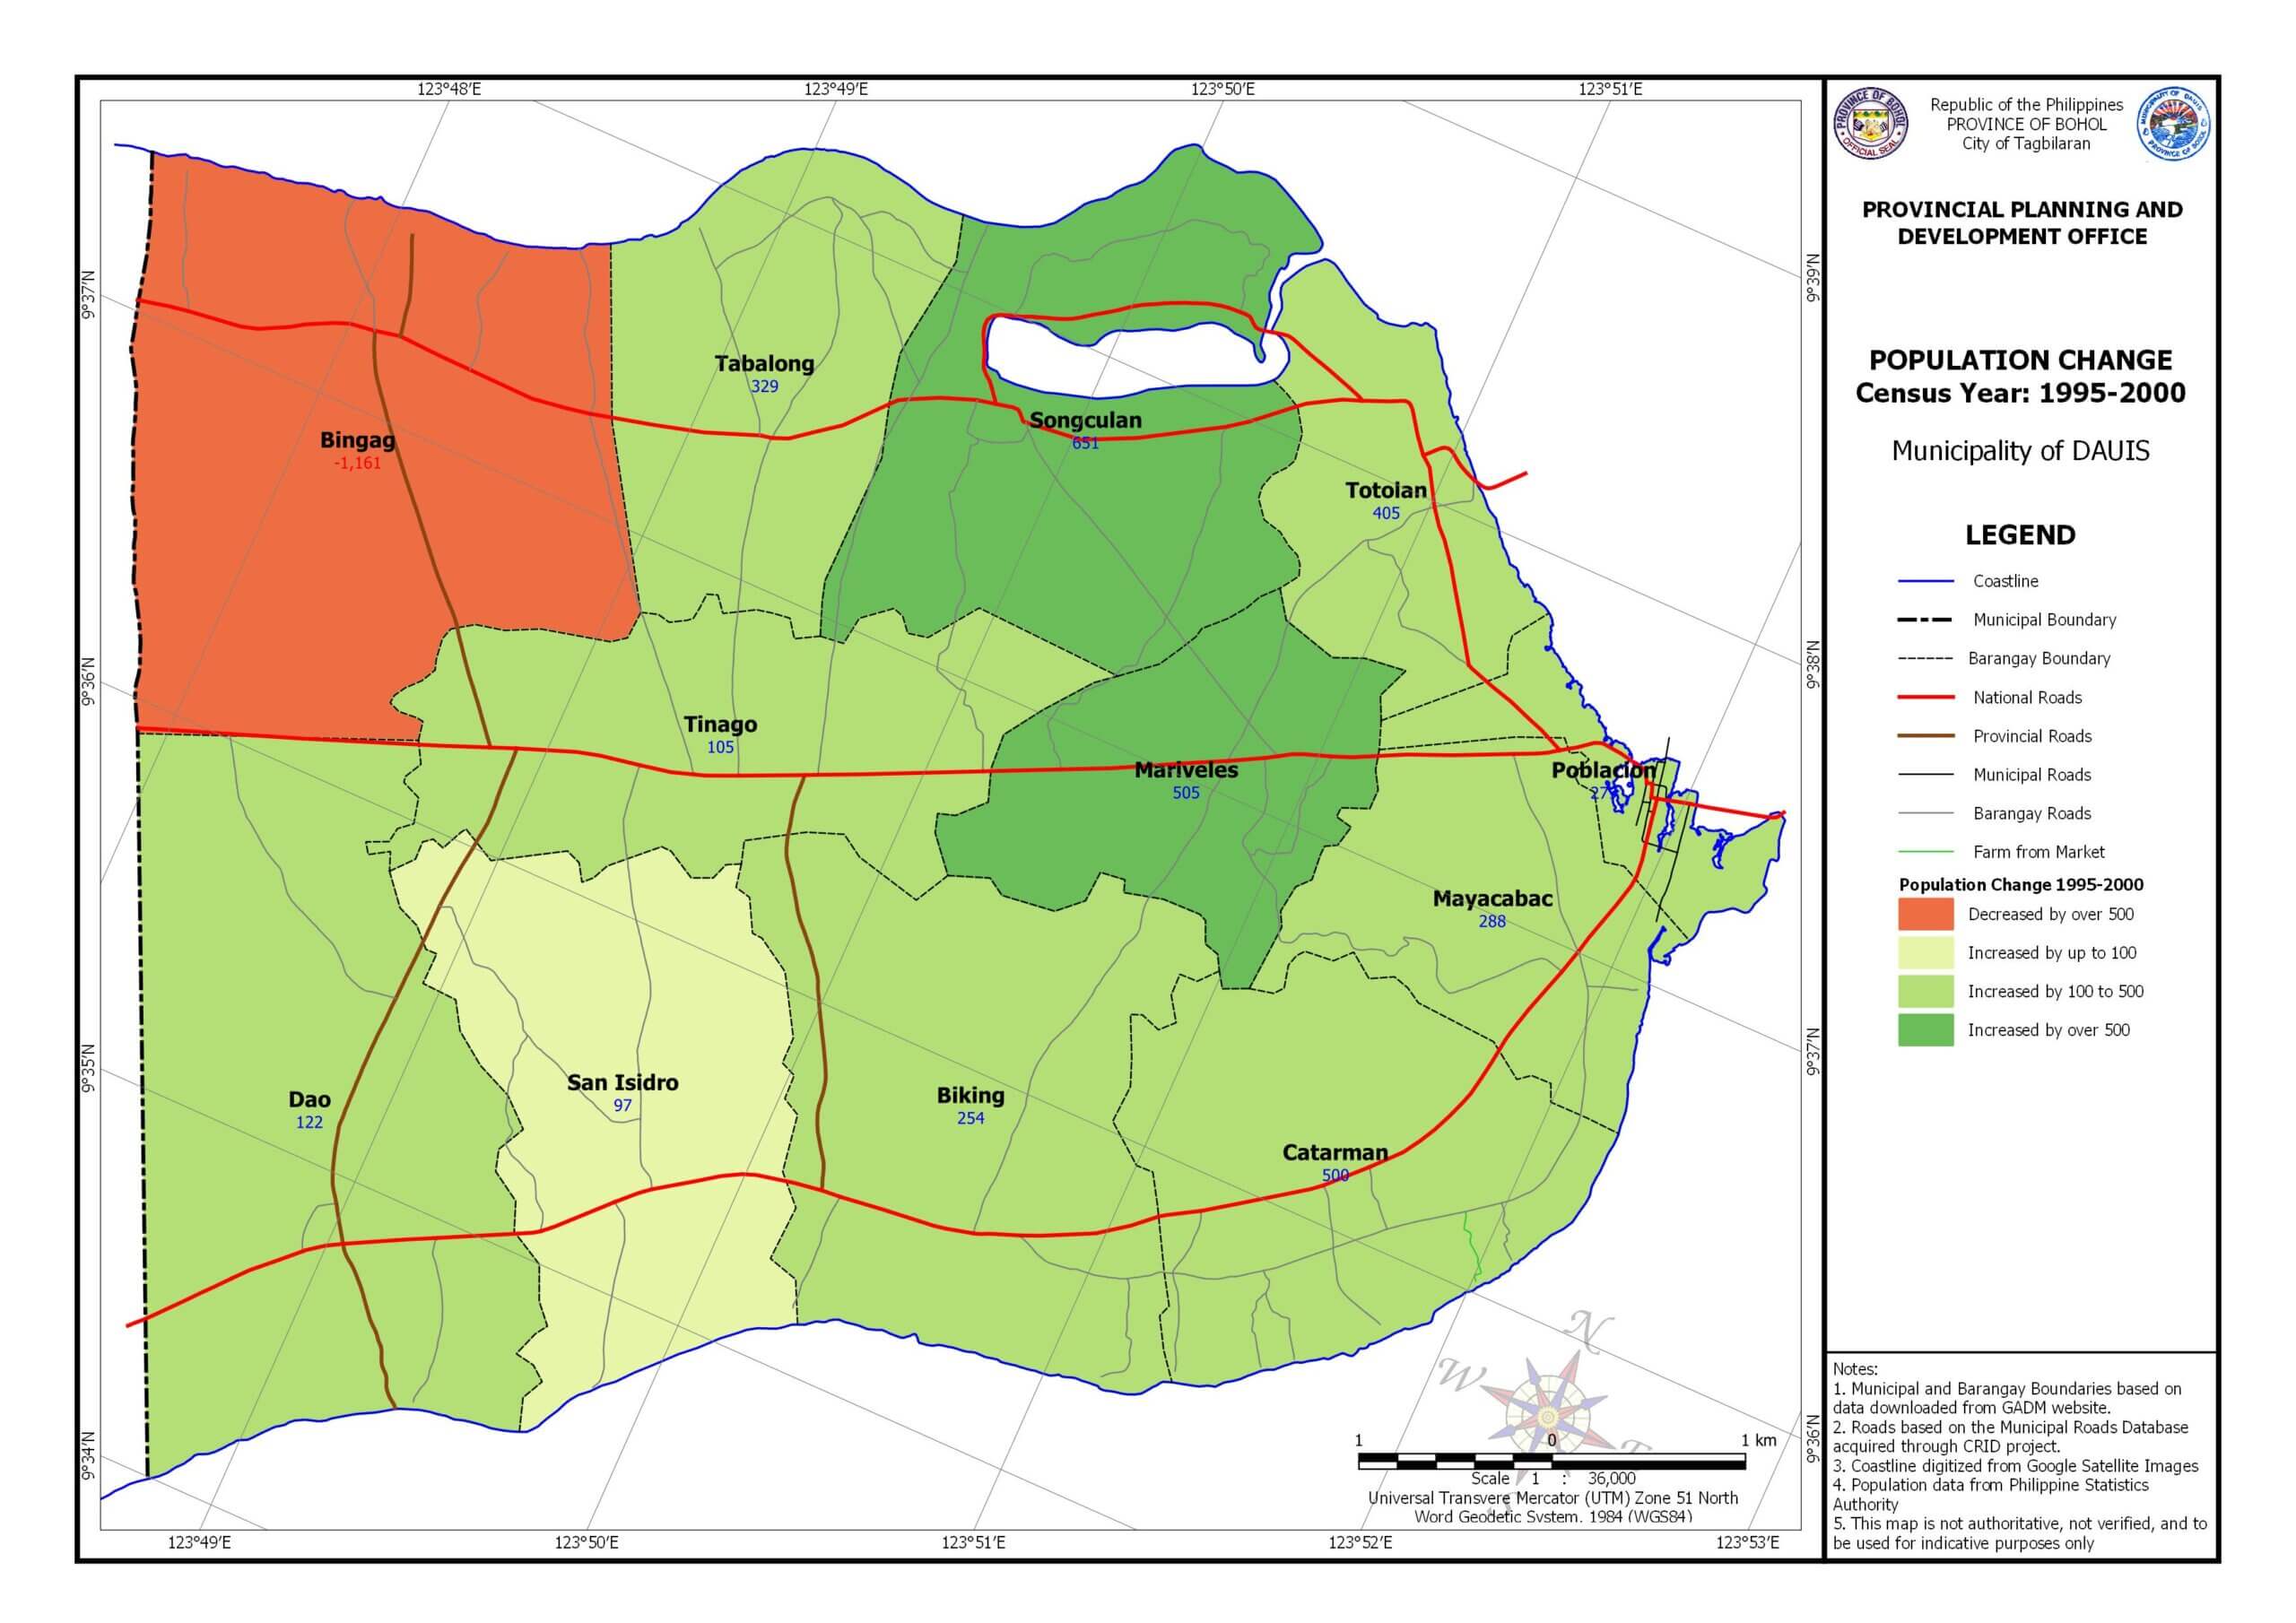
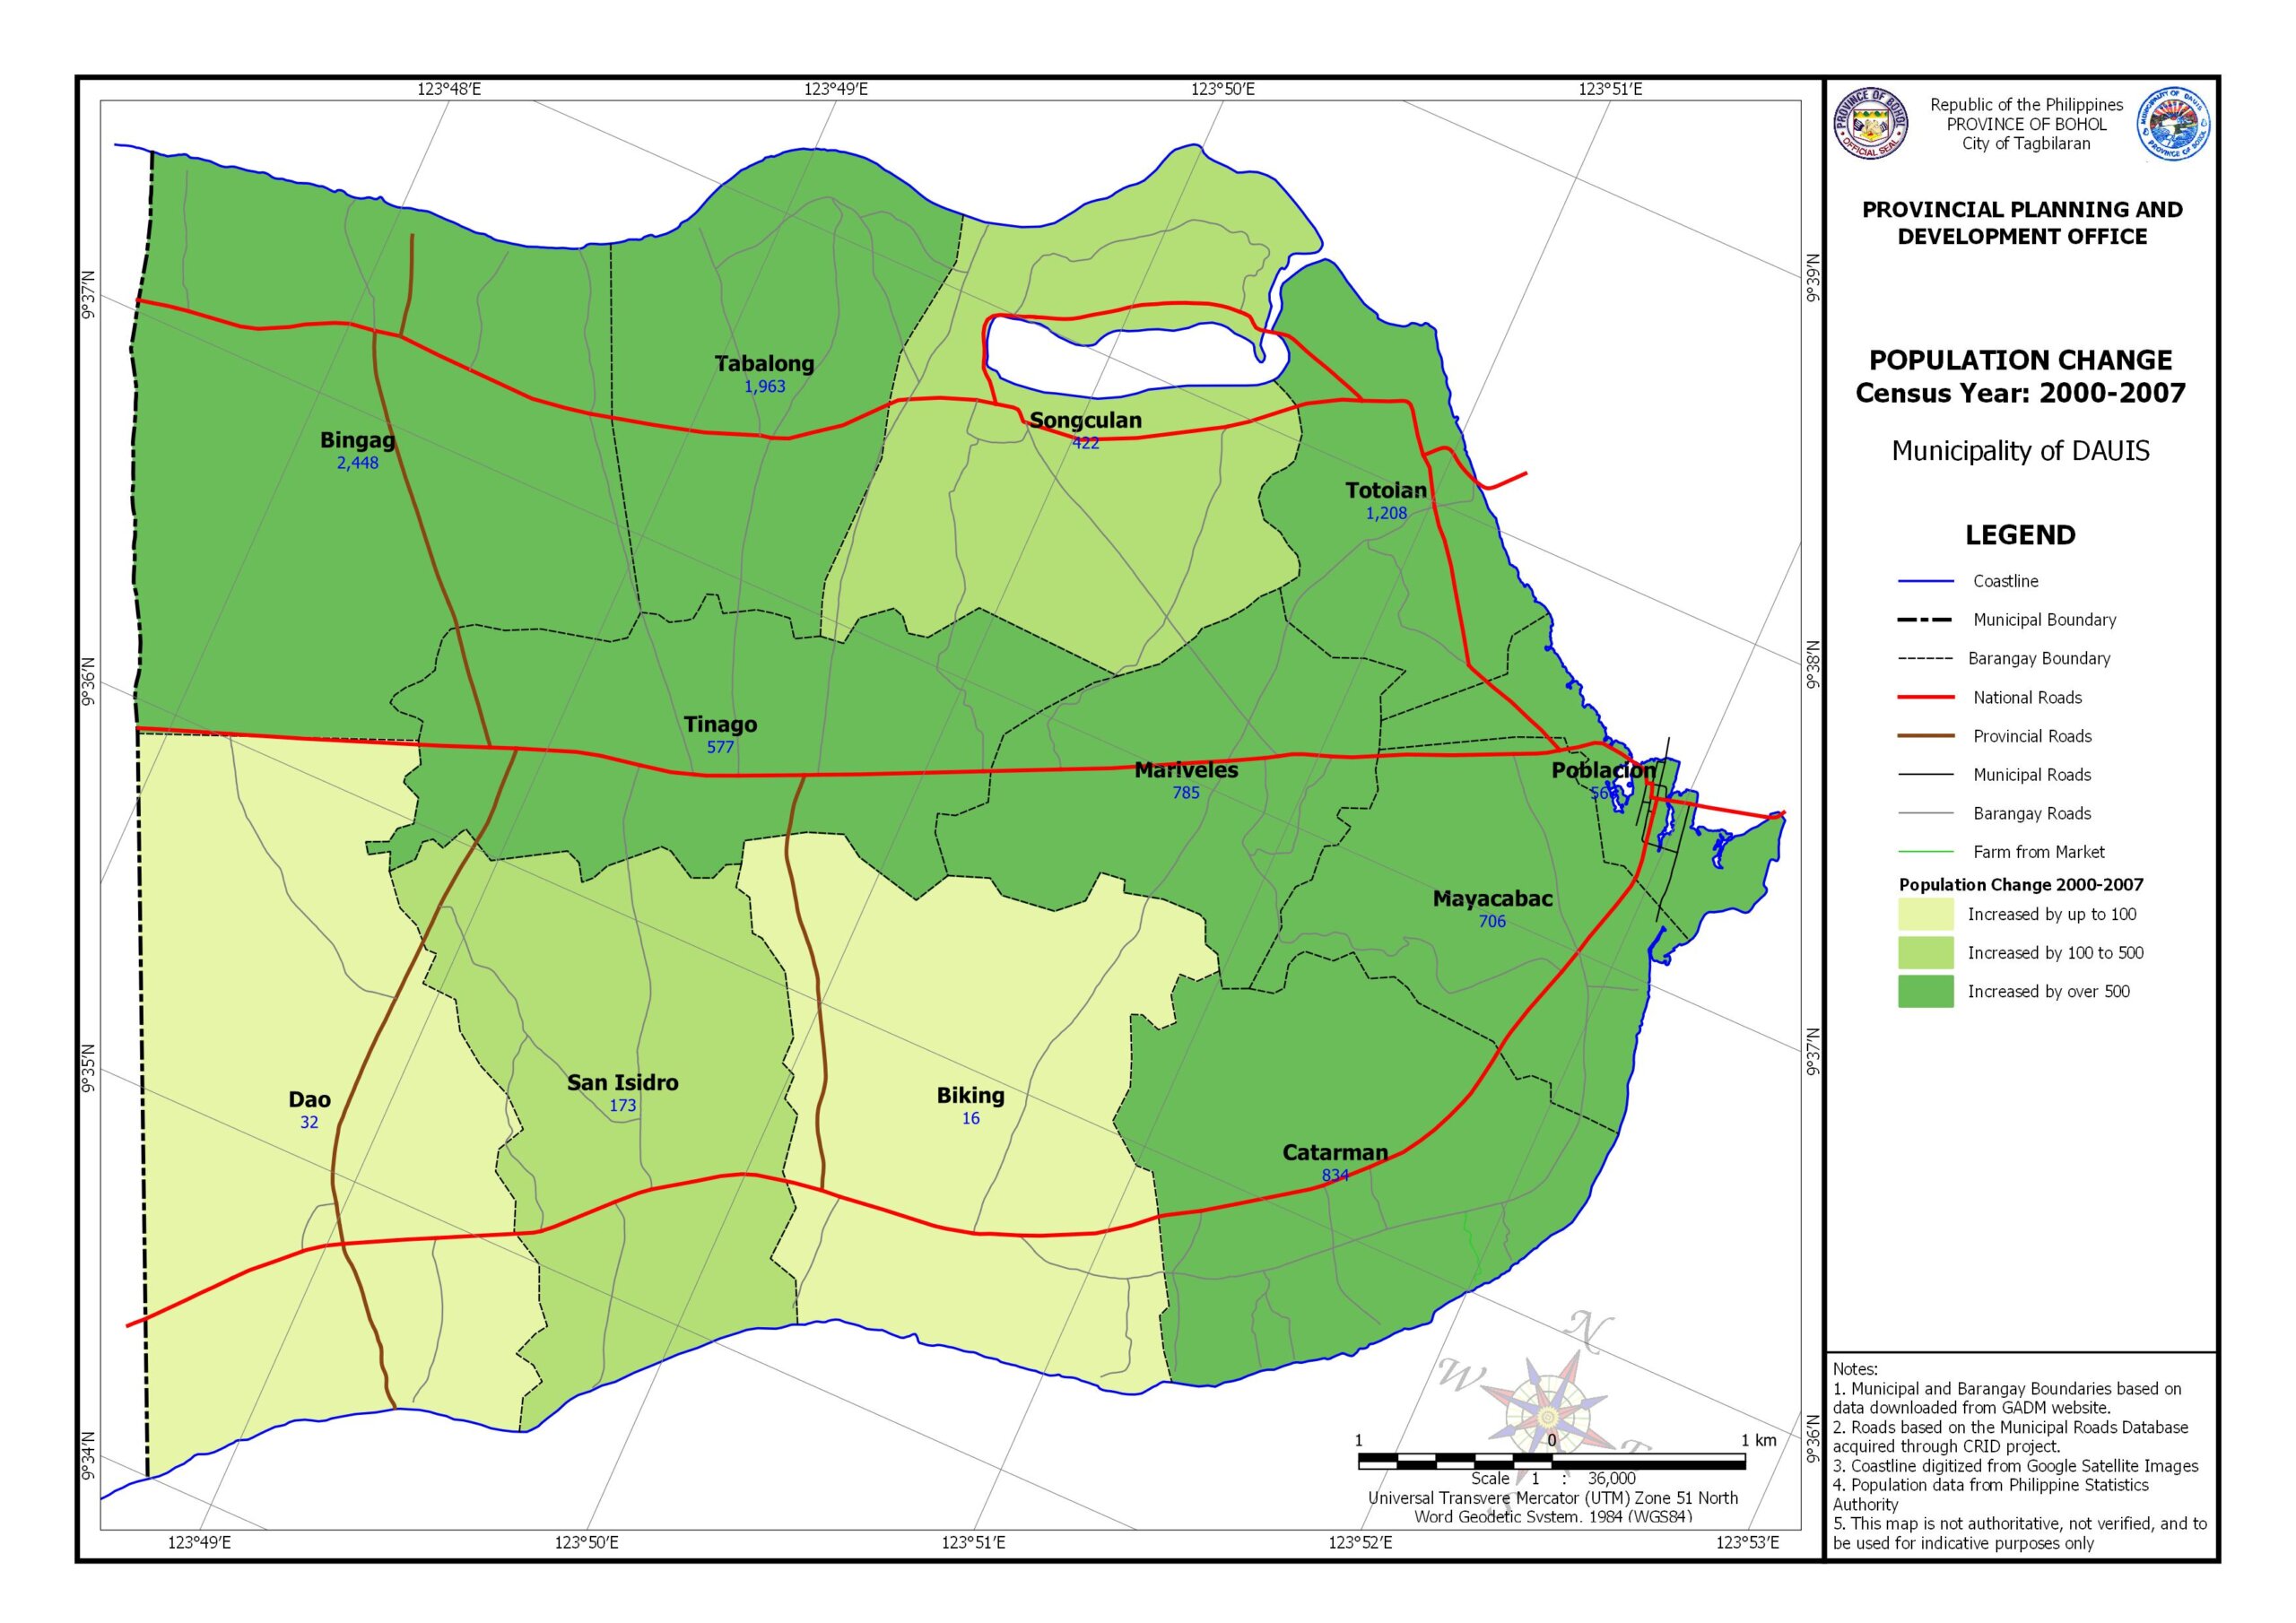
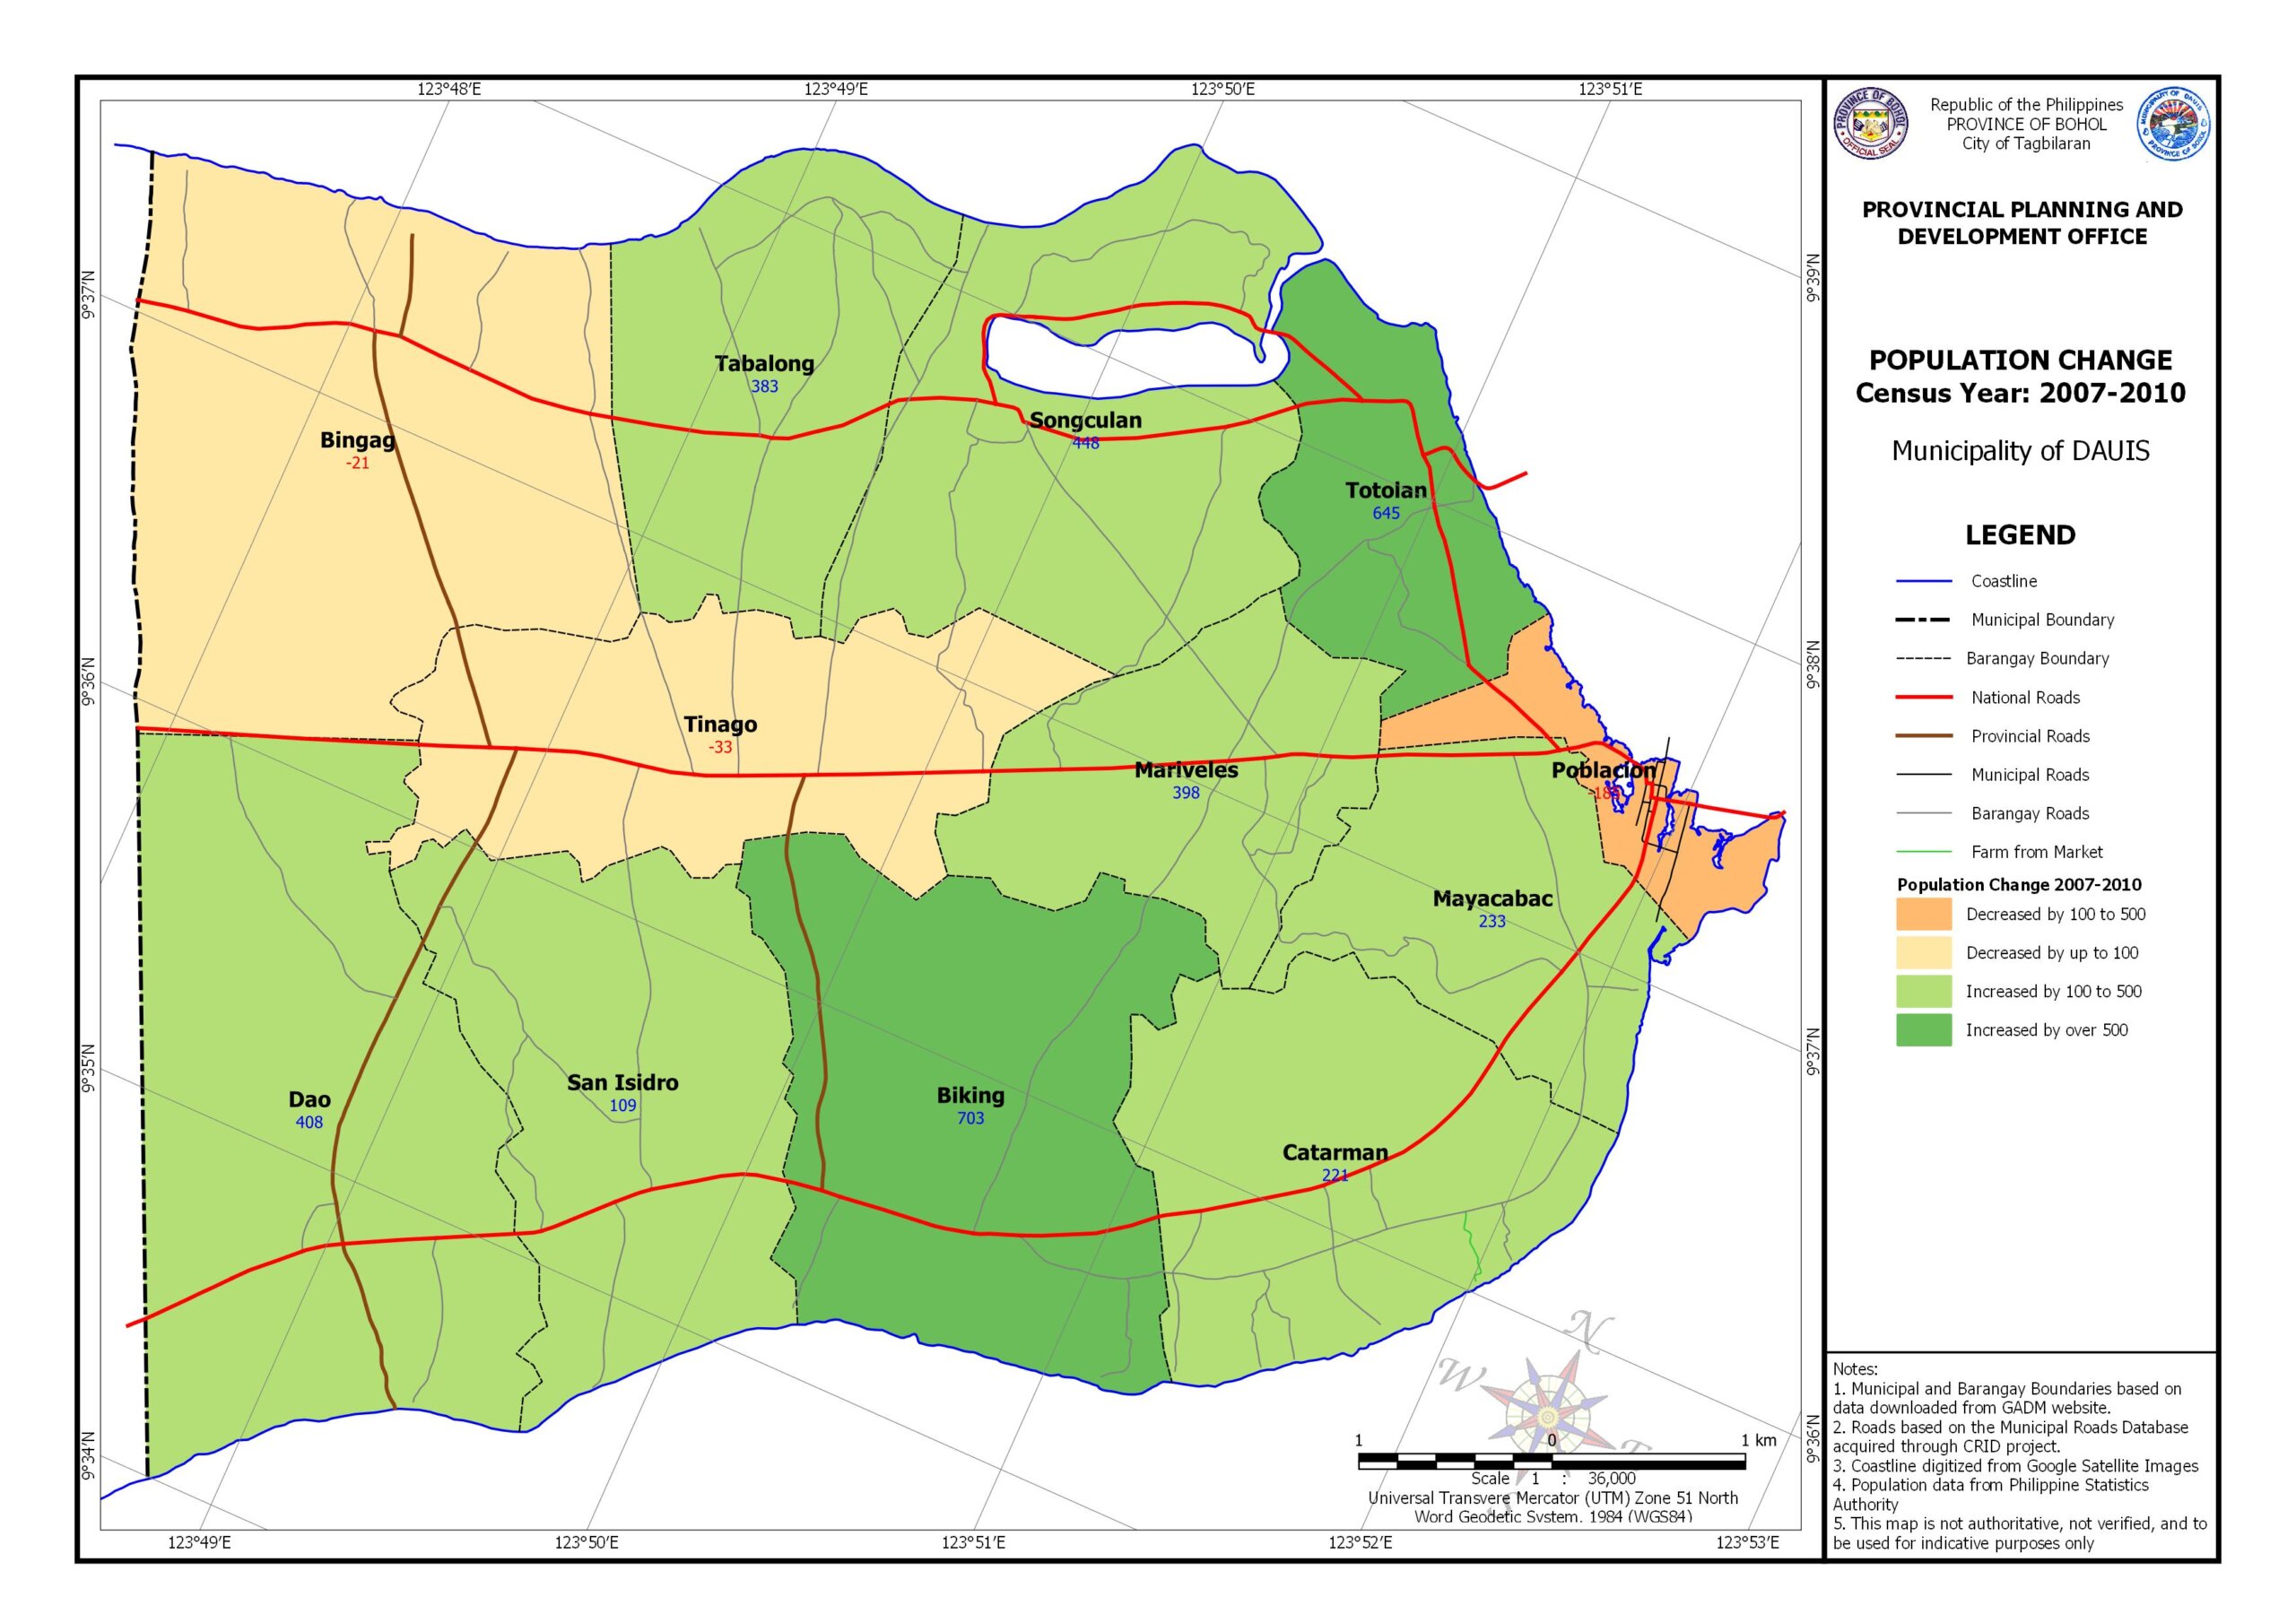
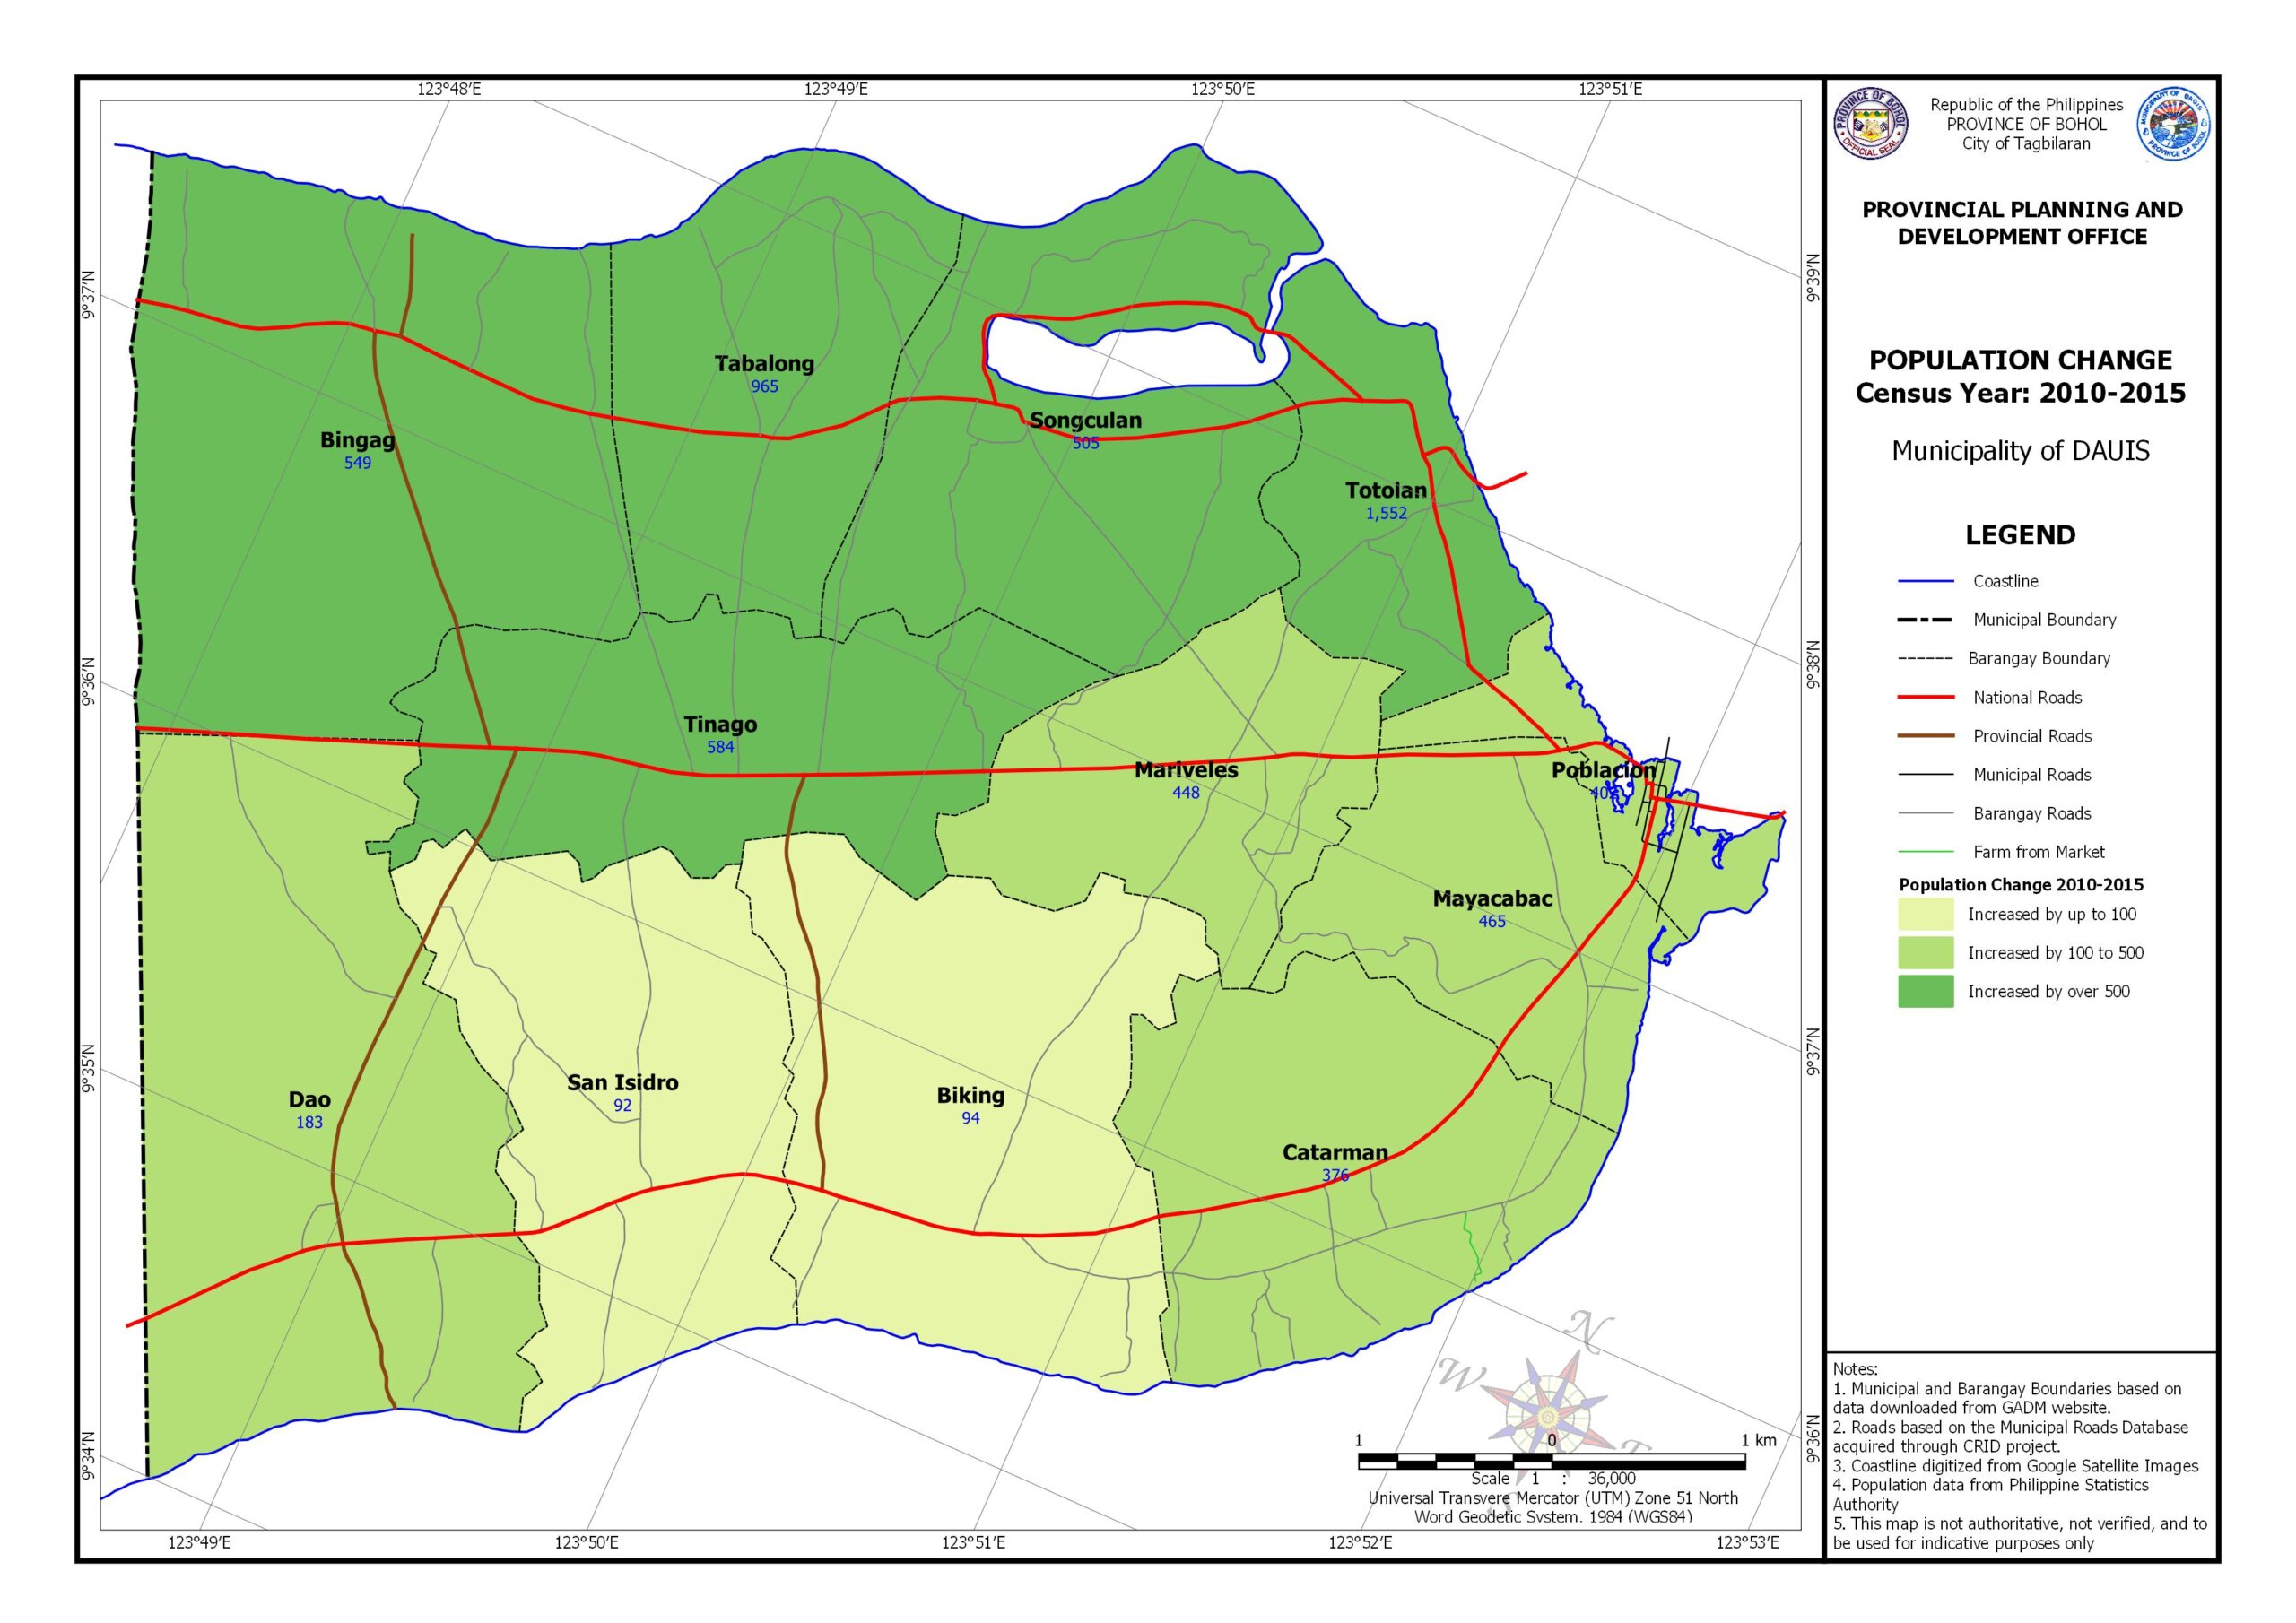
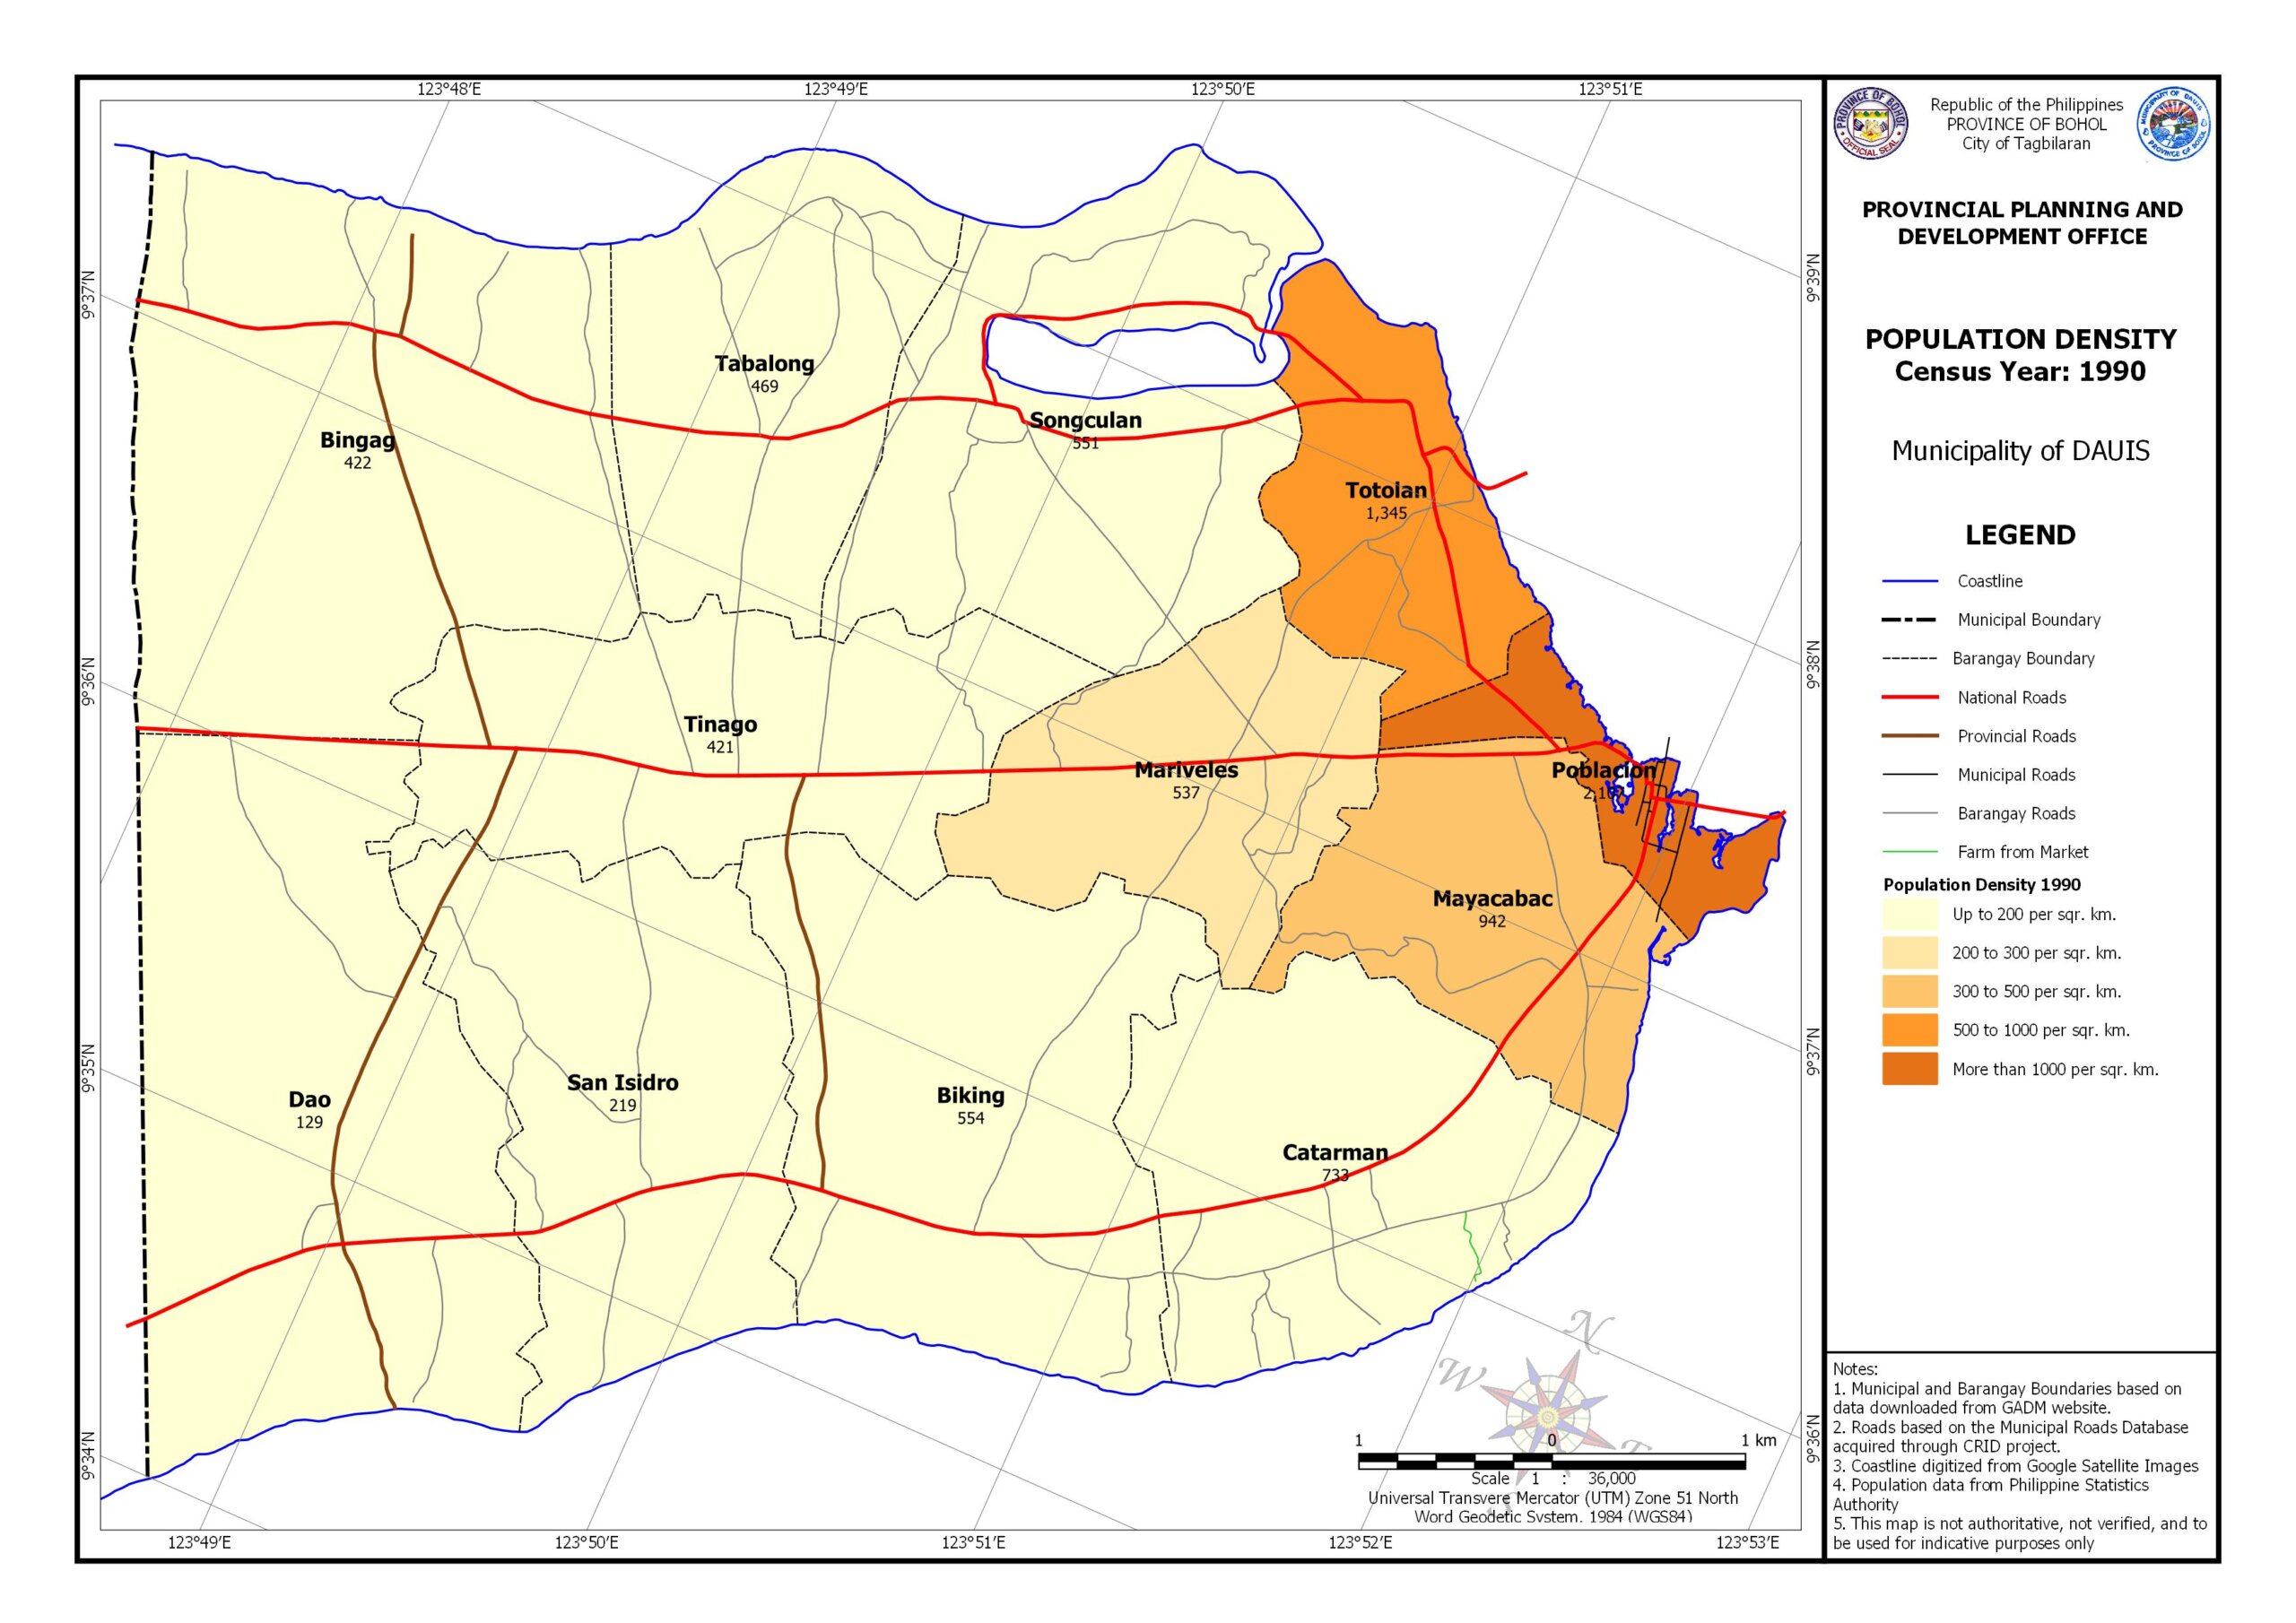
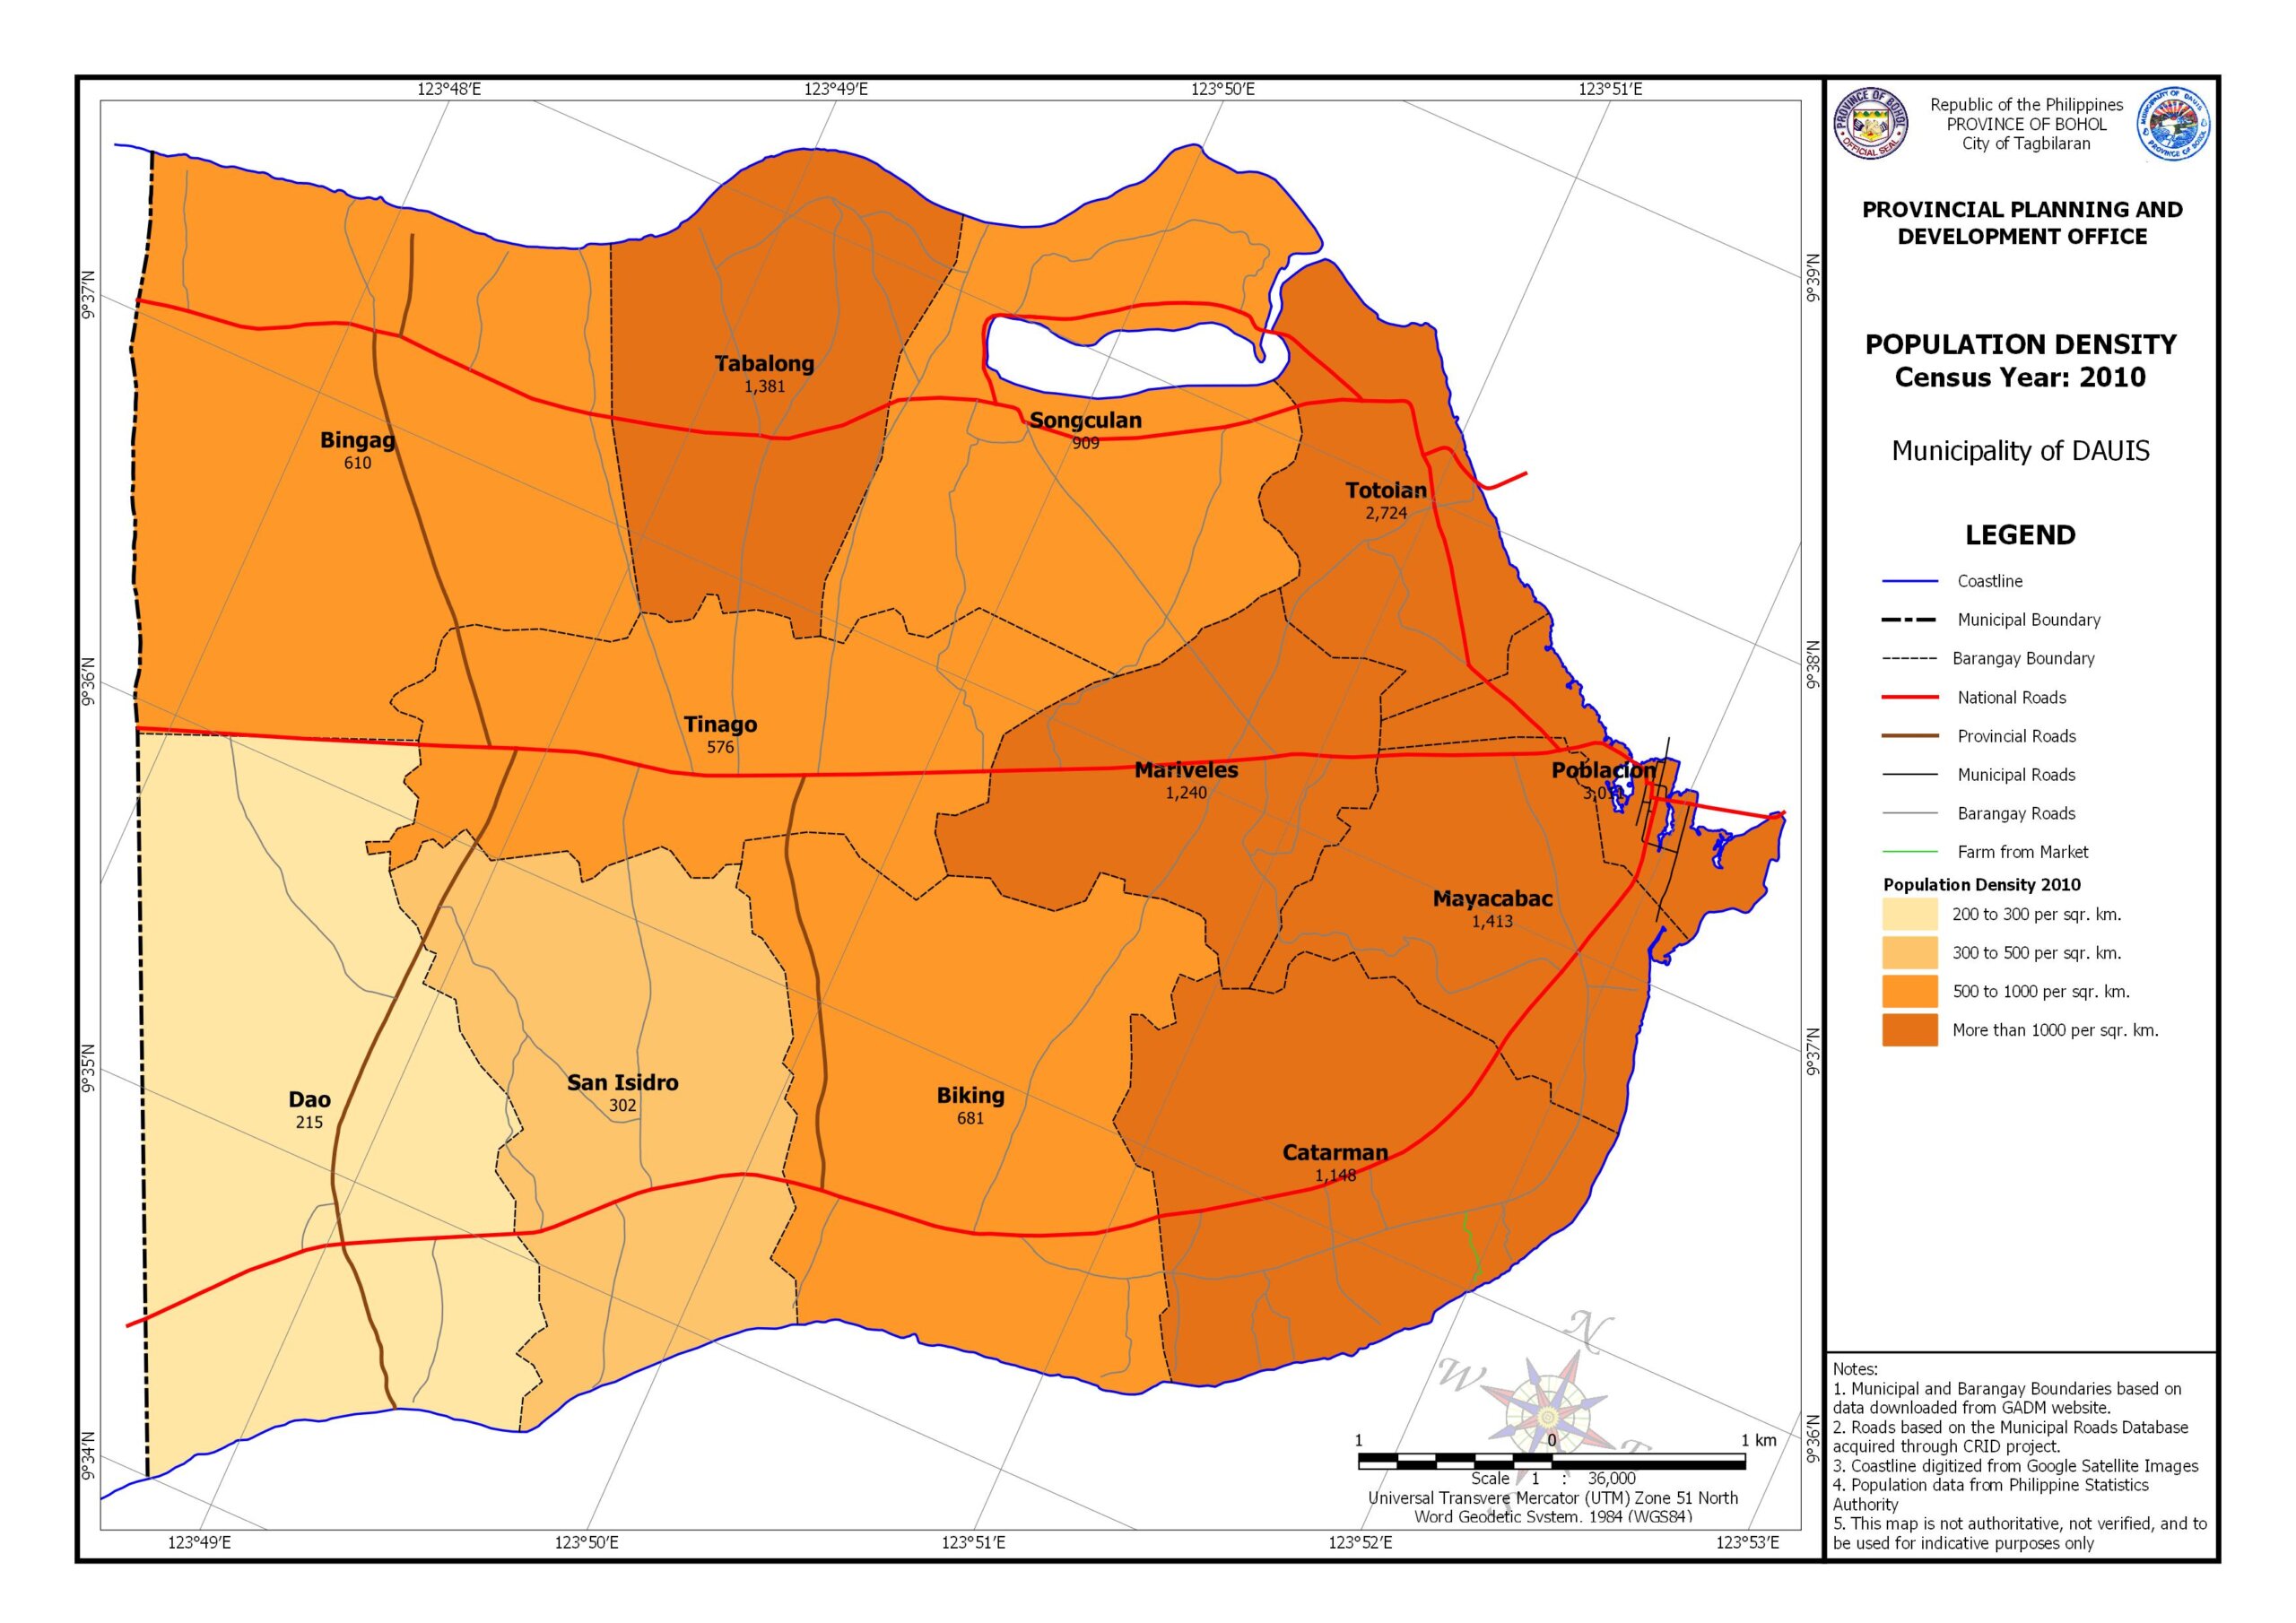
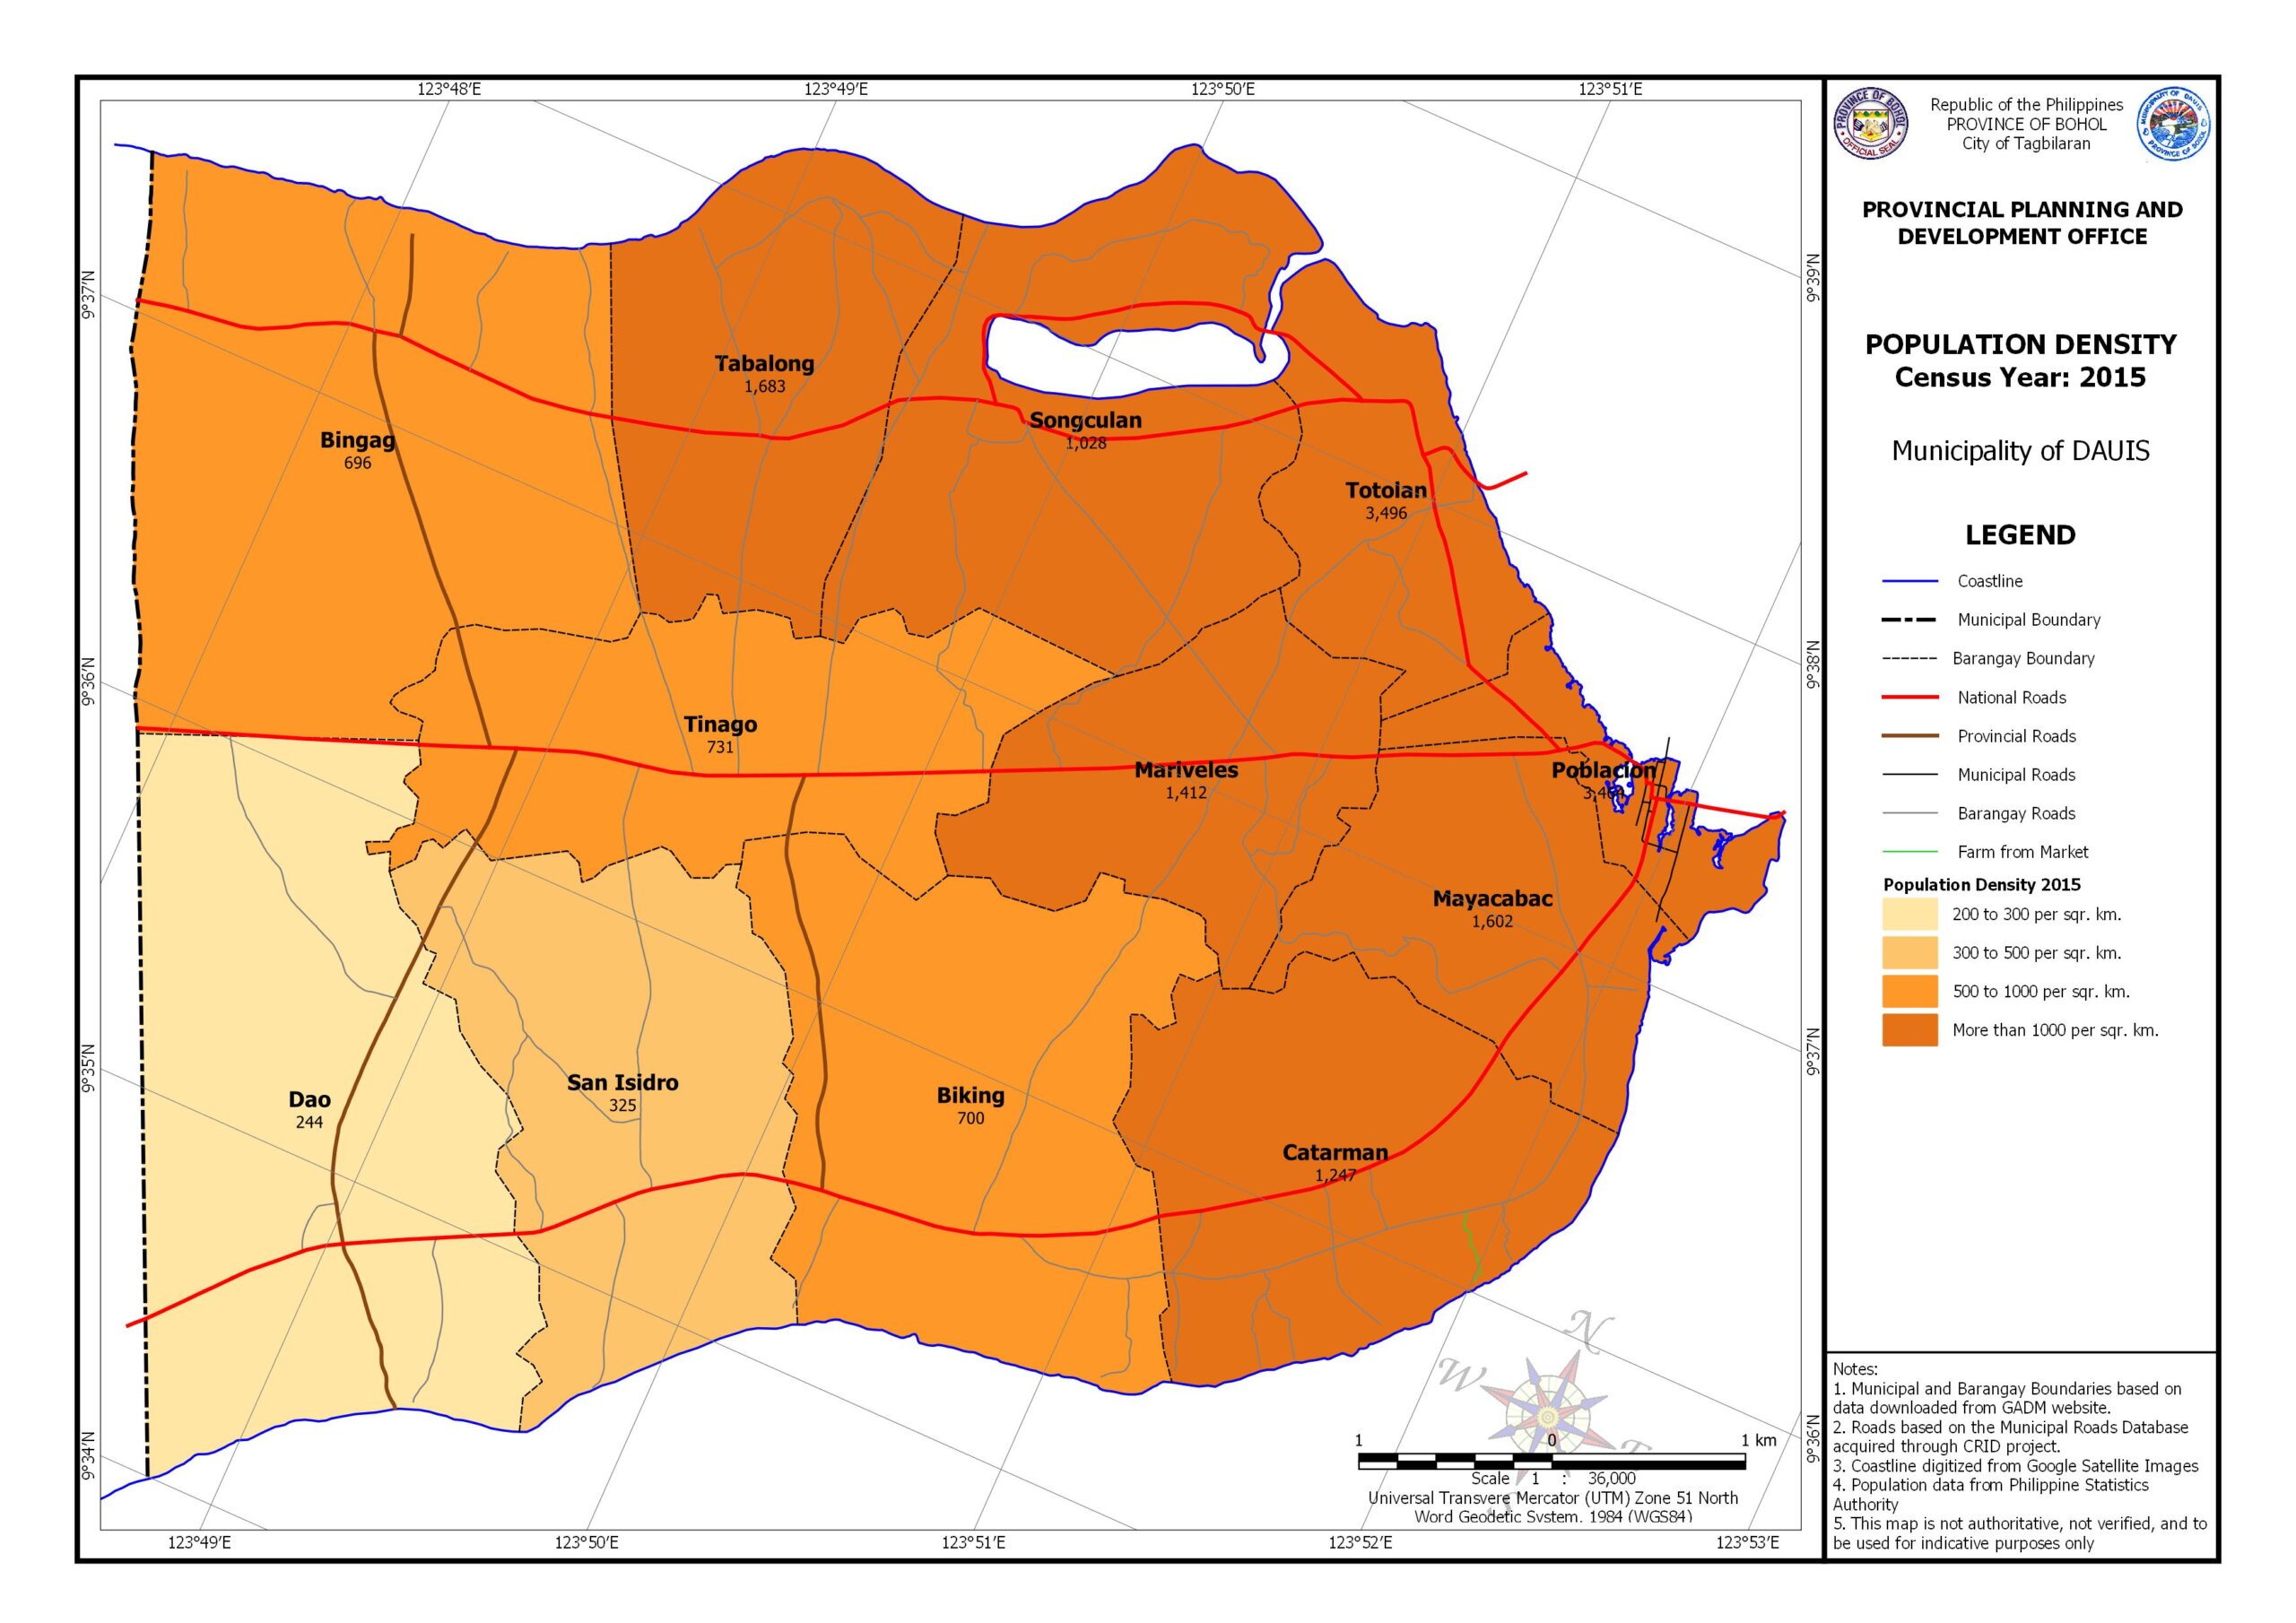
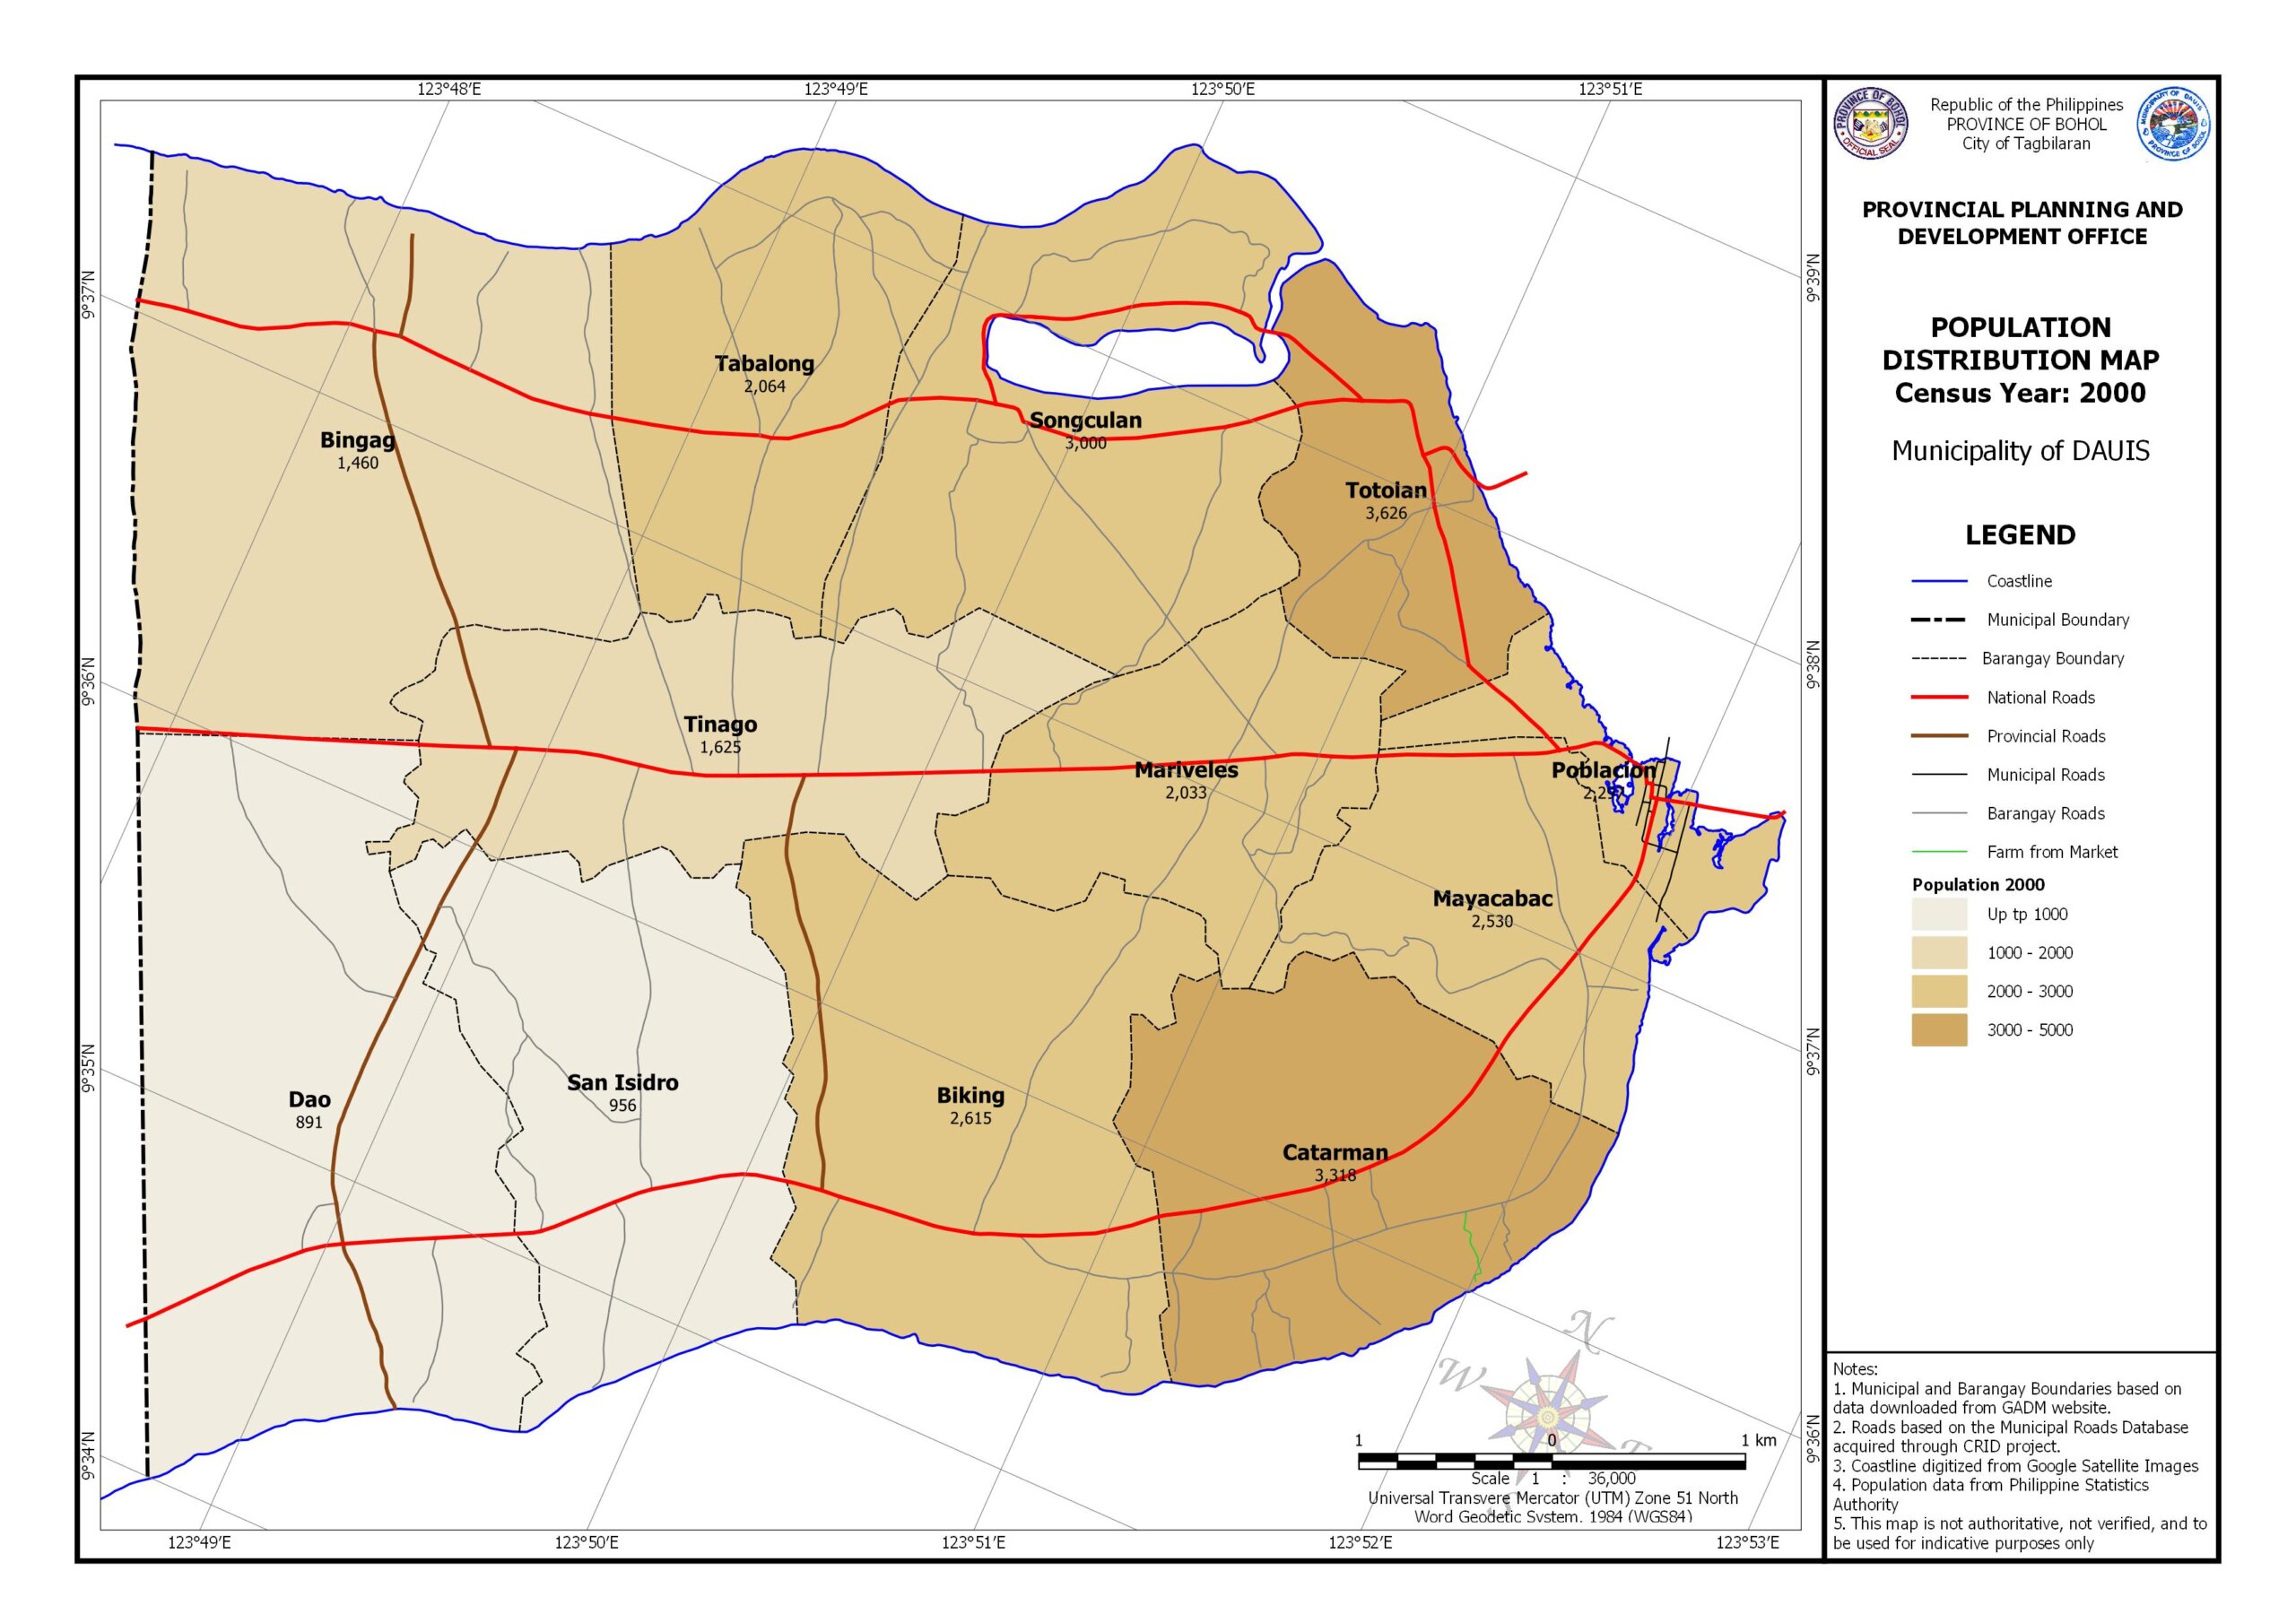
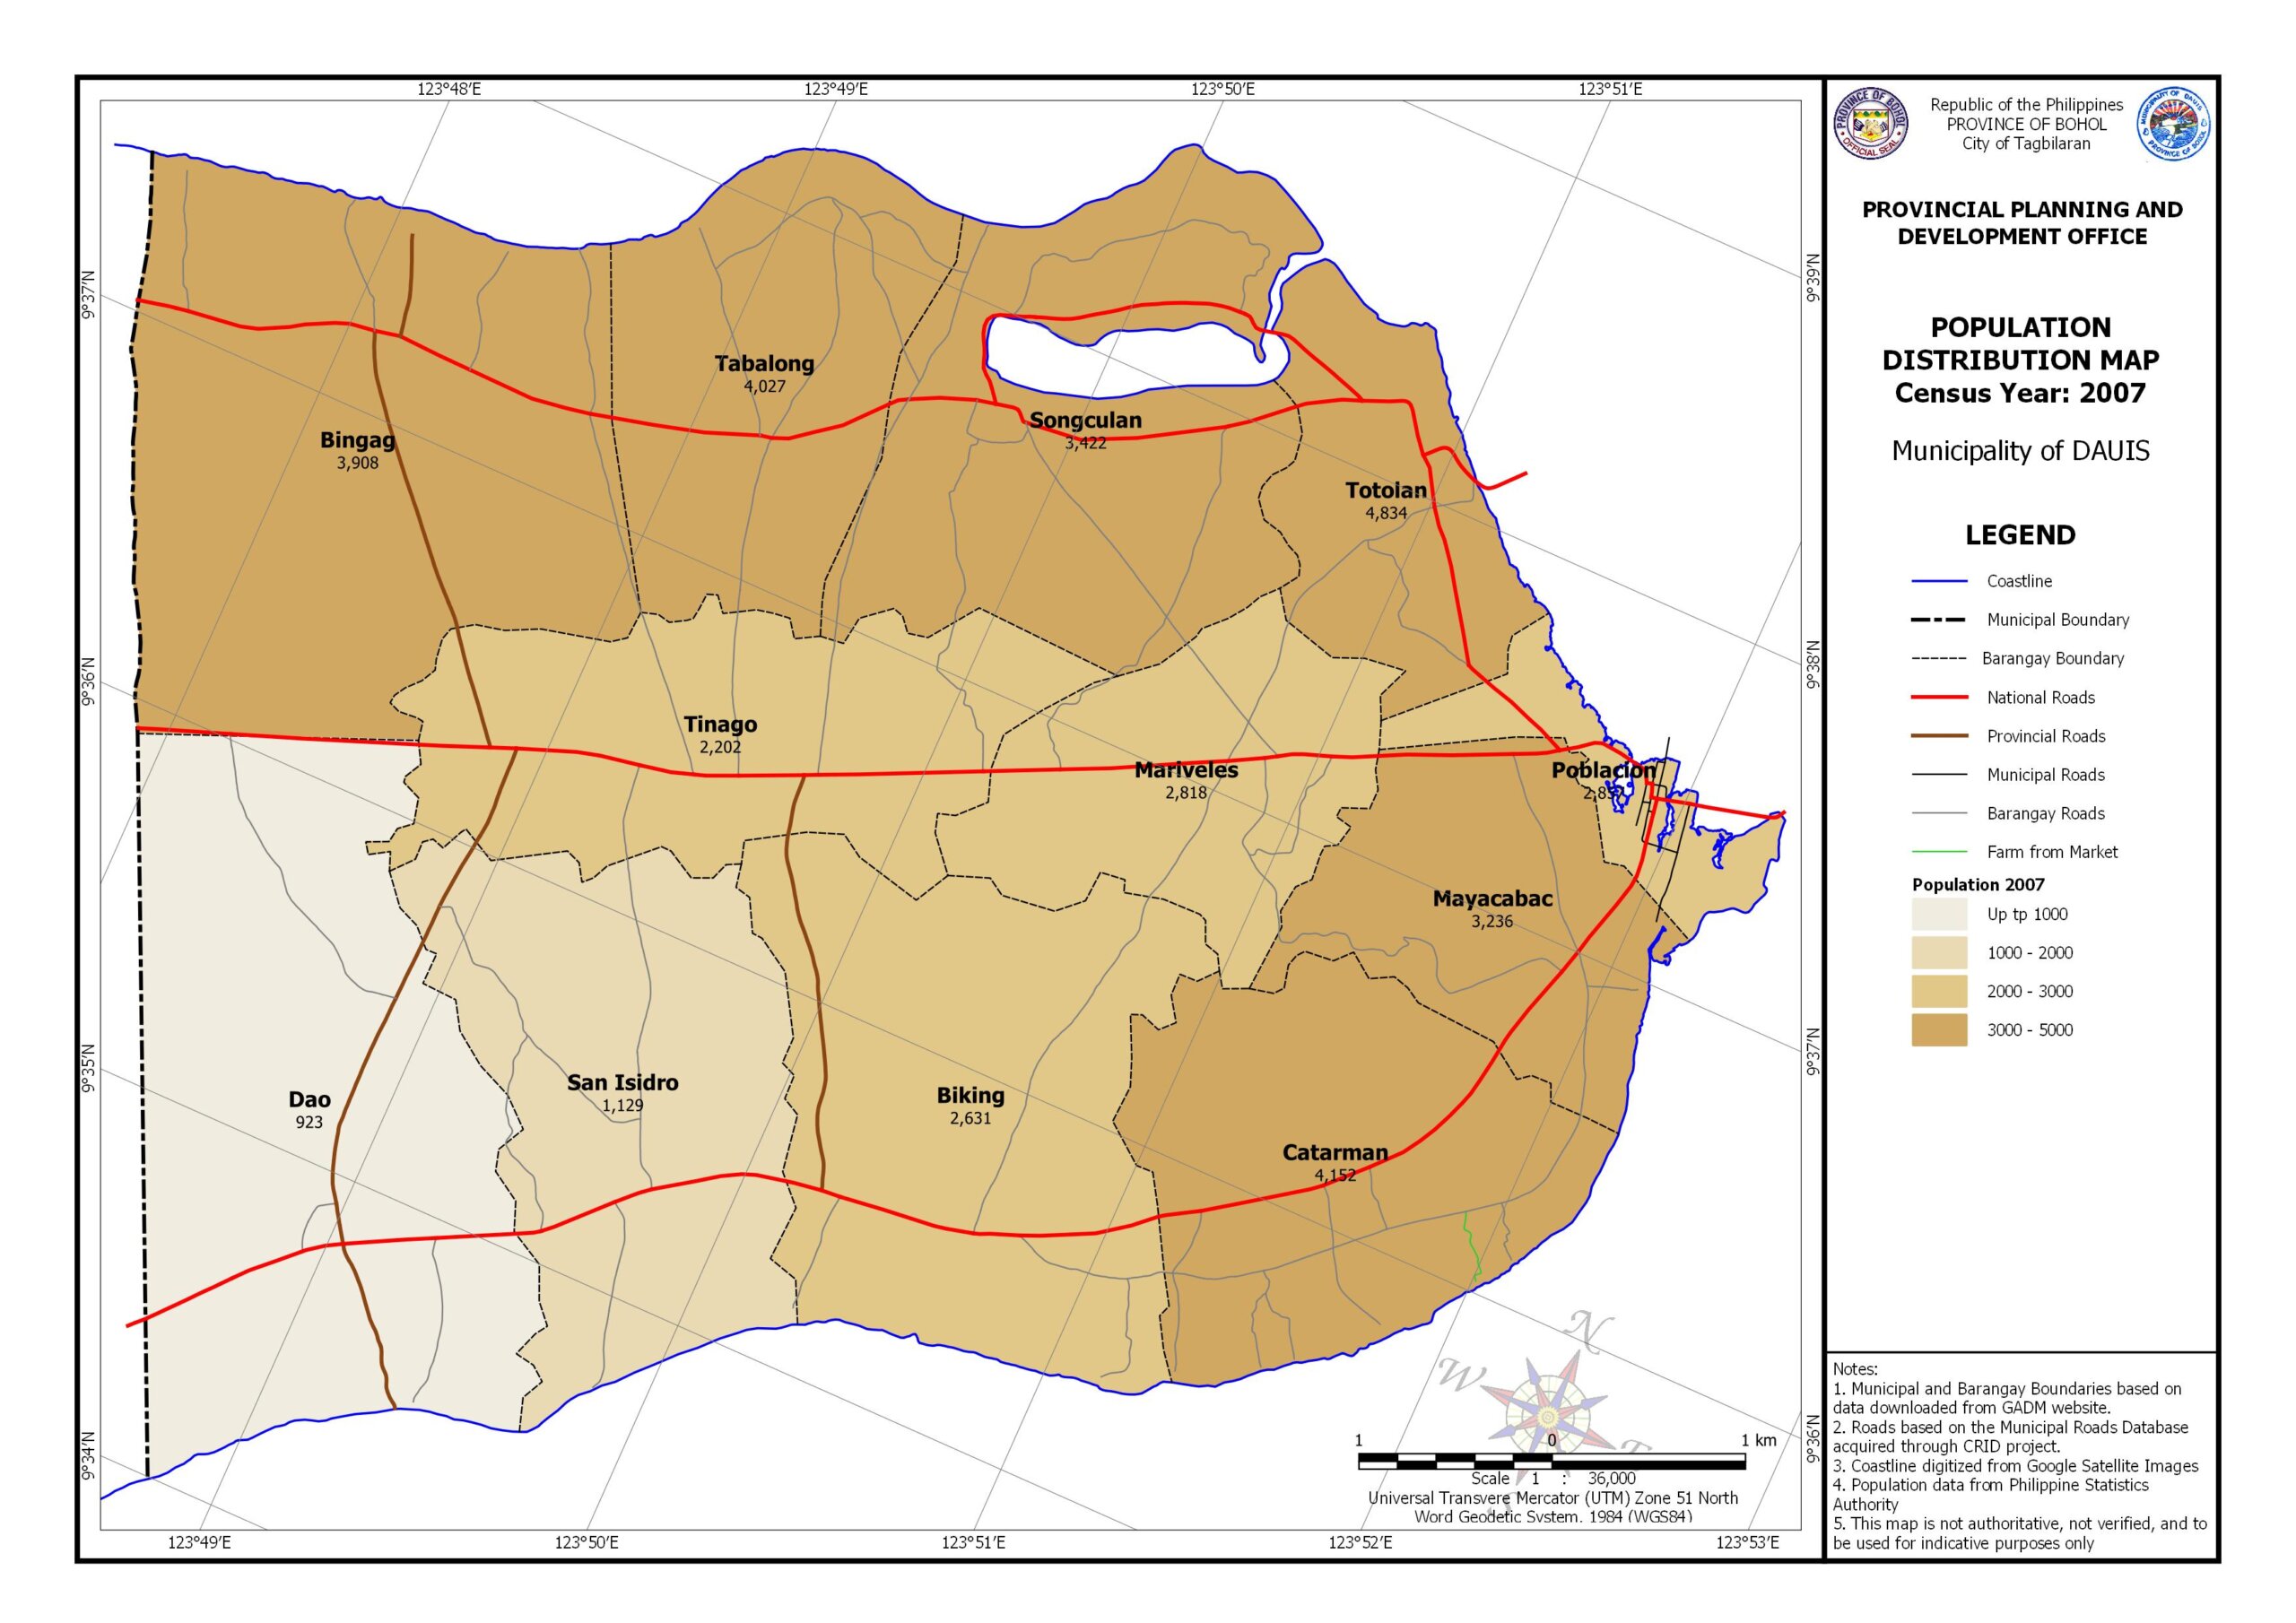
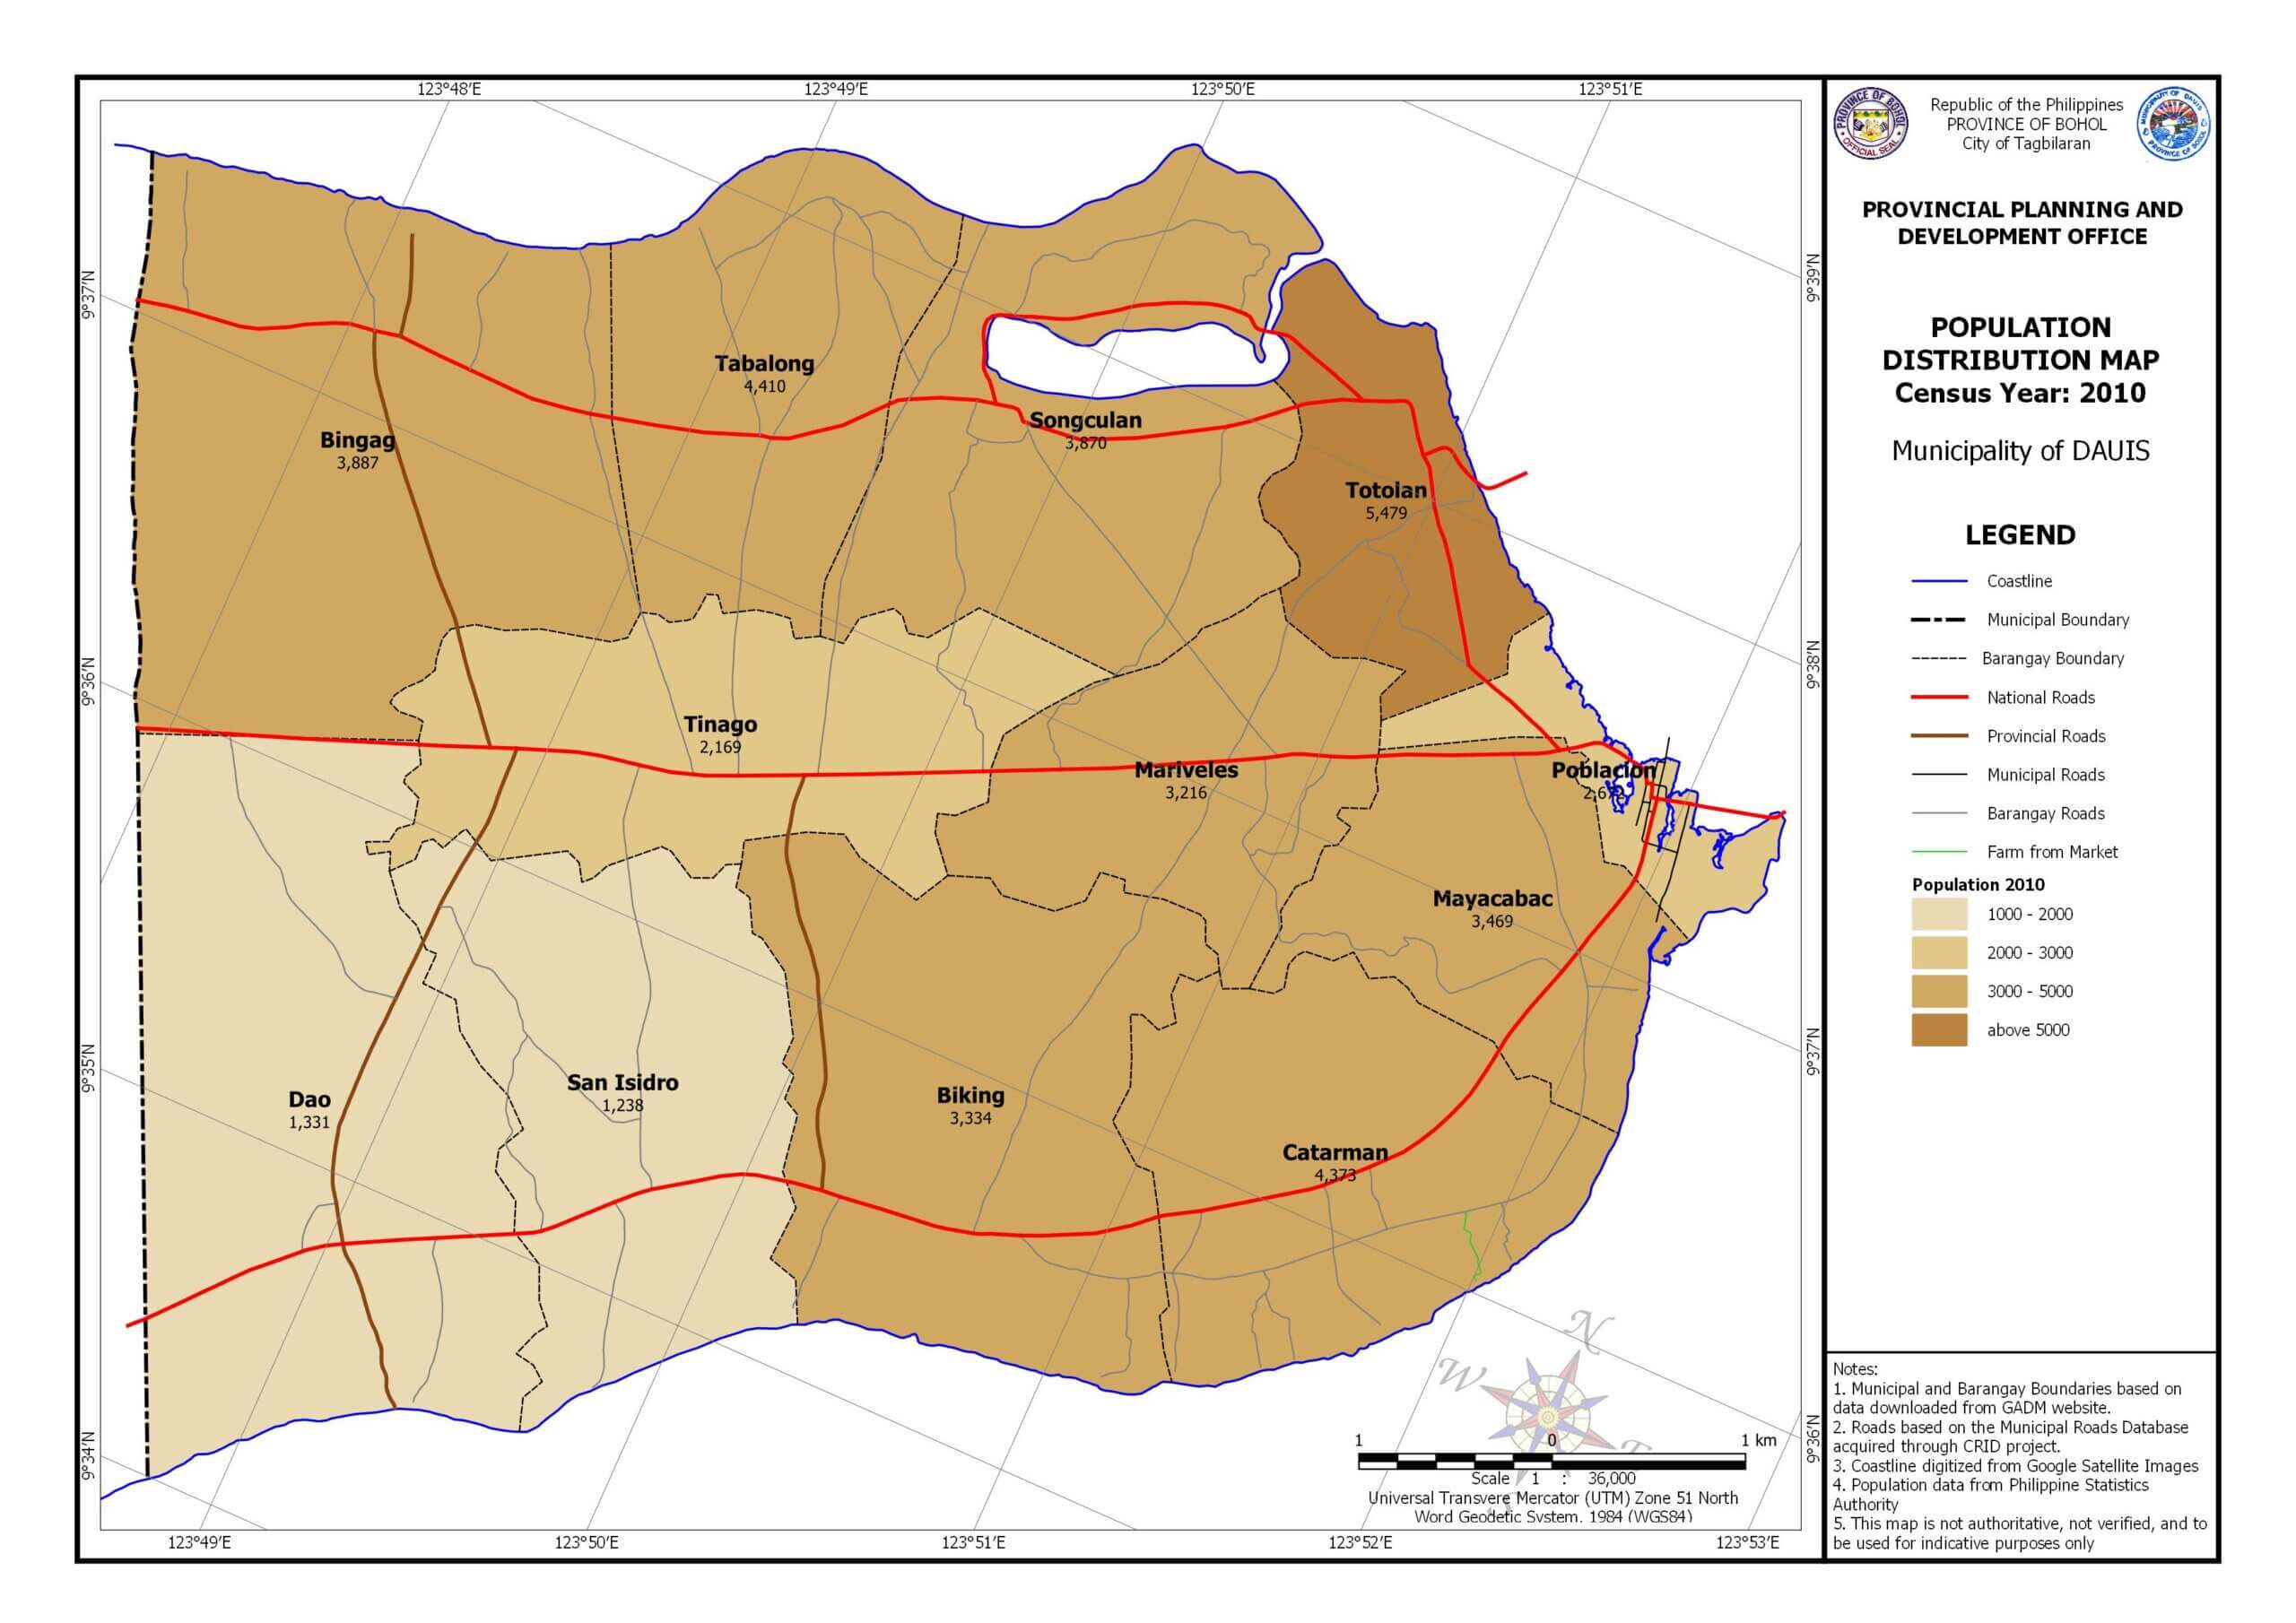
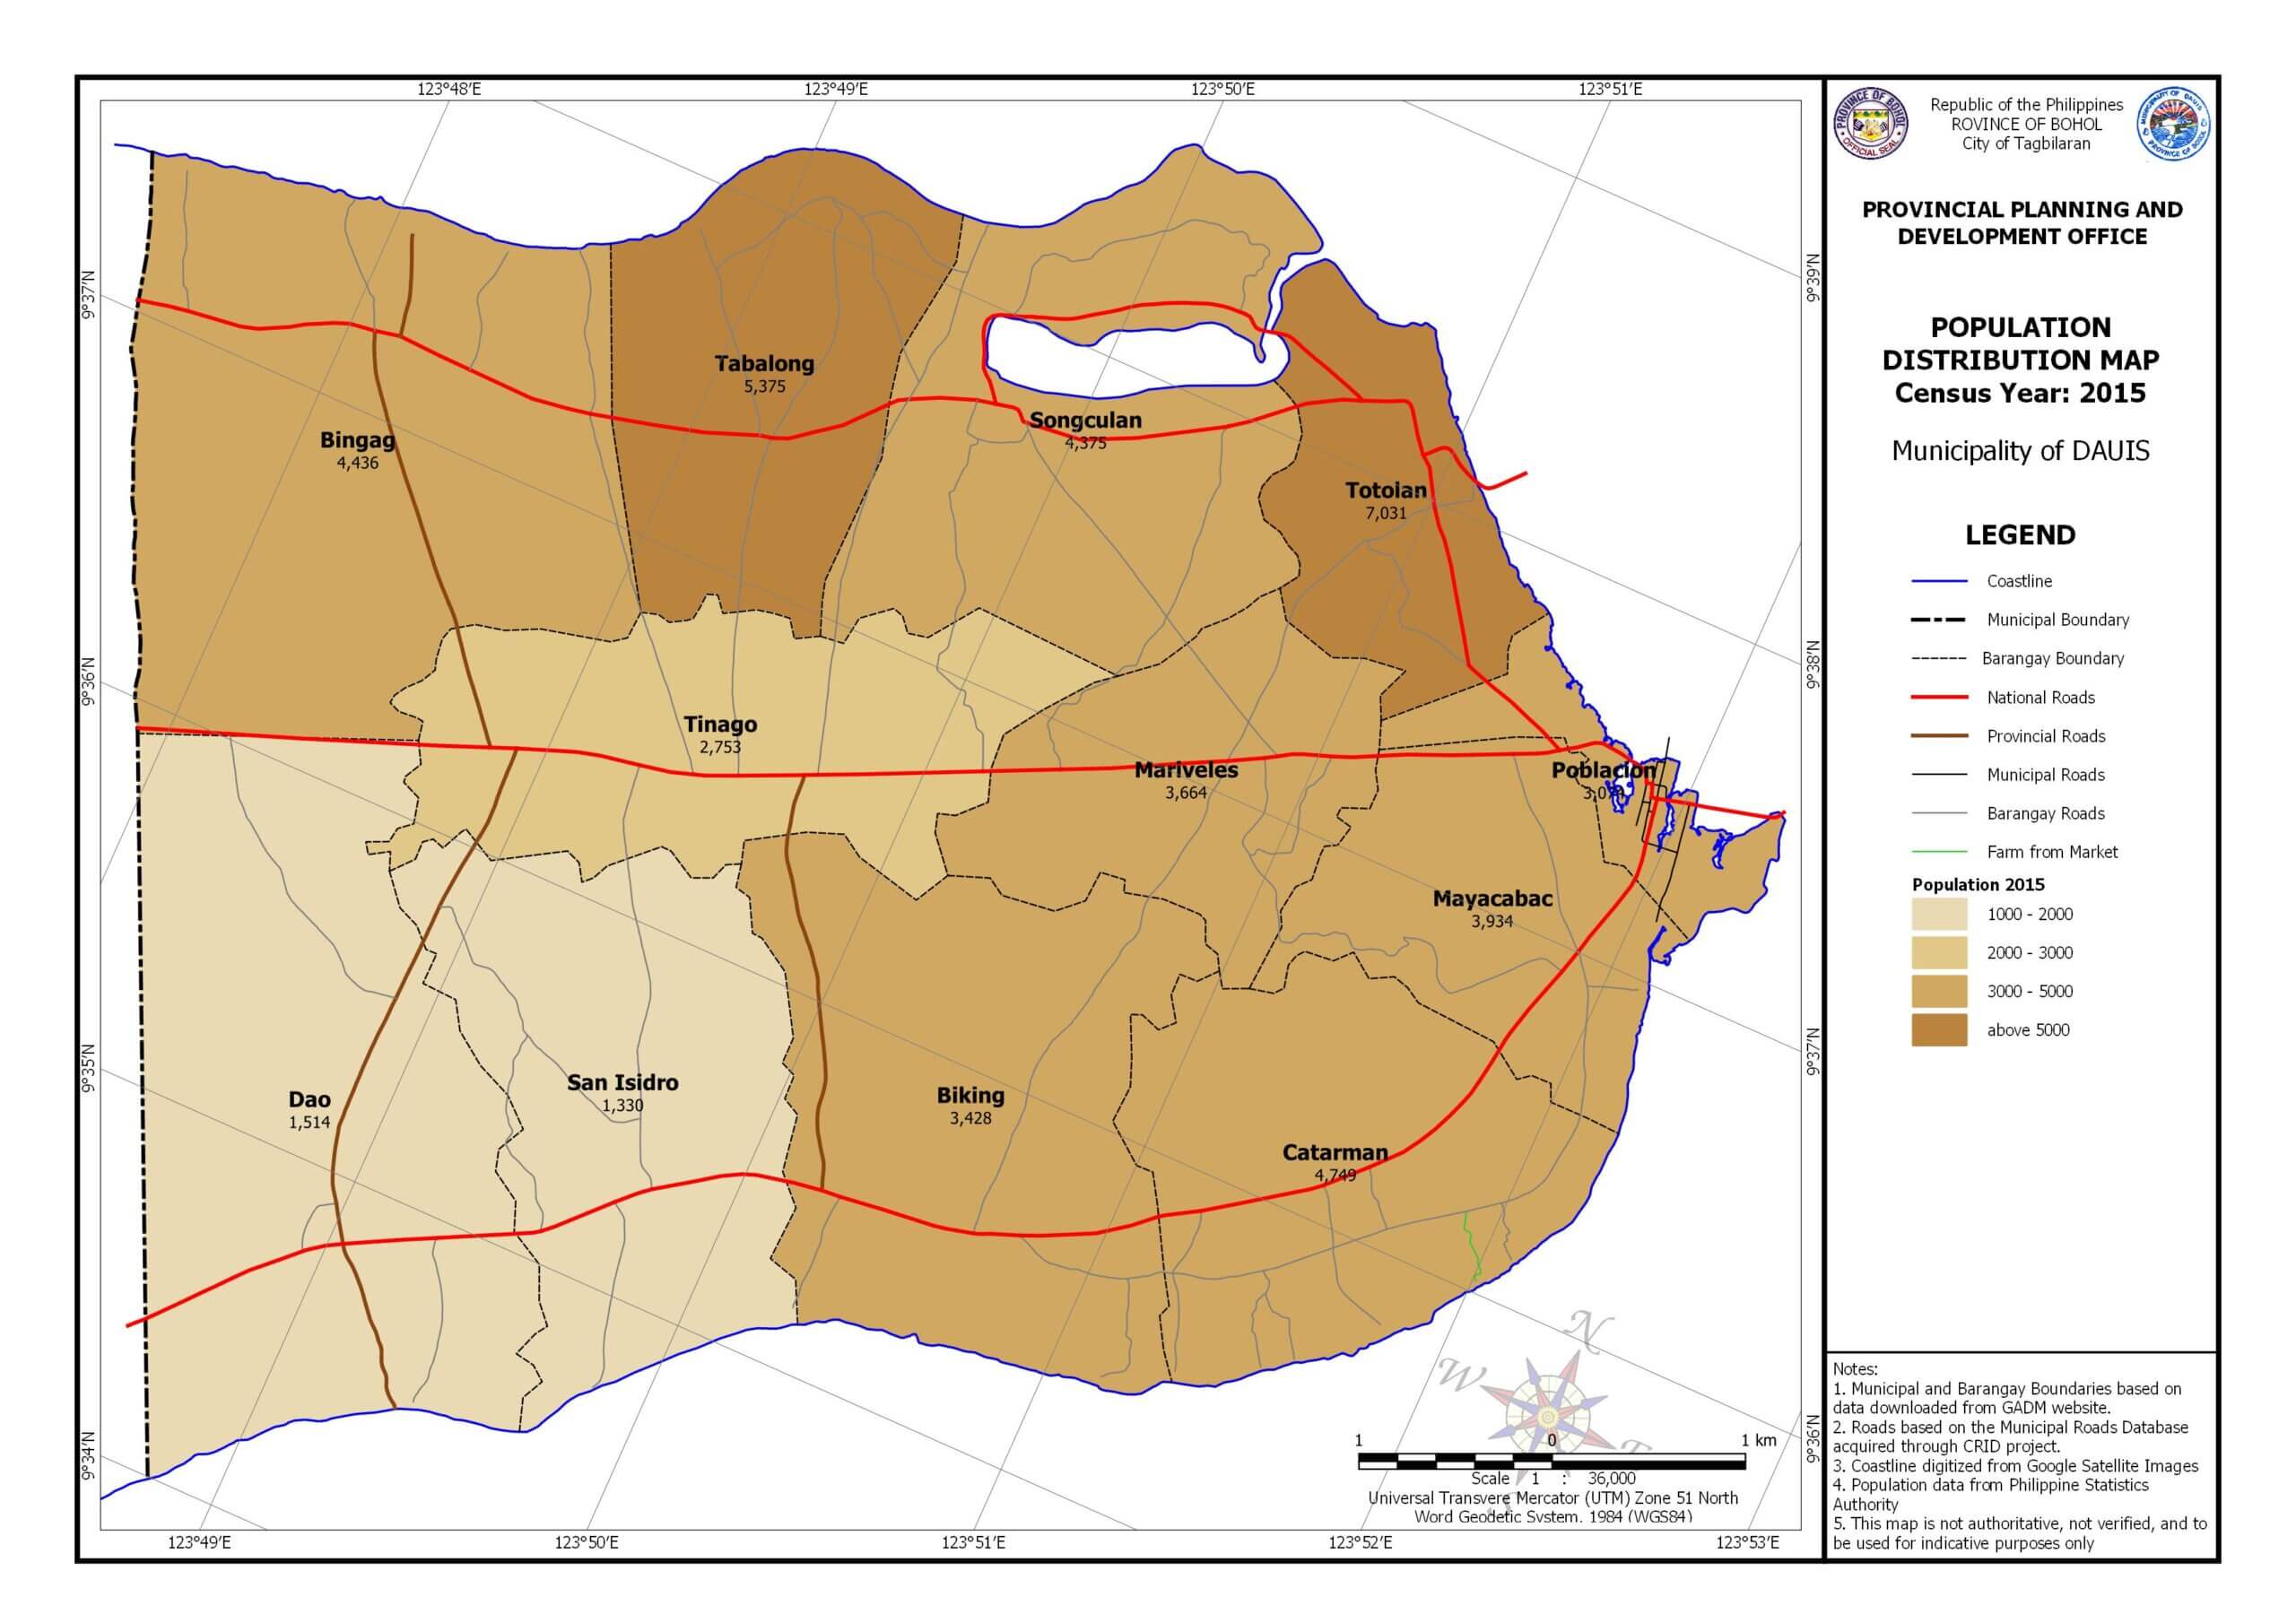
| Population | : | 36,525 (2007 NSO Census ) 40,387 ( 2010 projected ) 50,137 ( 2015 projected ) |
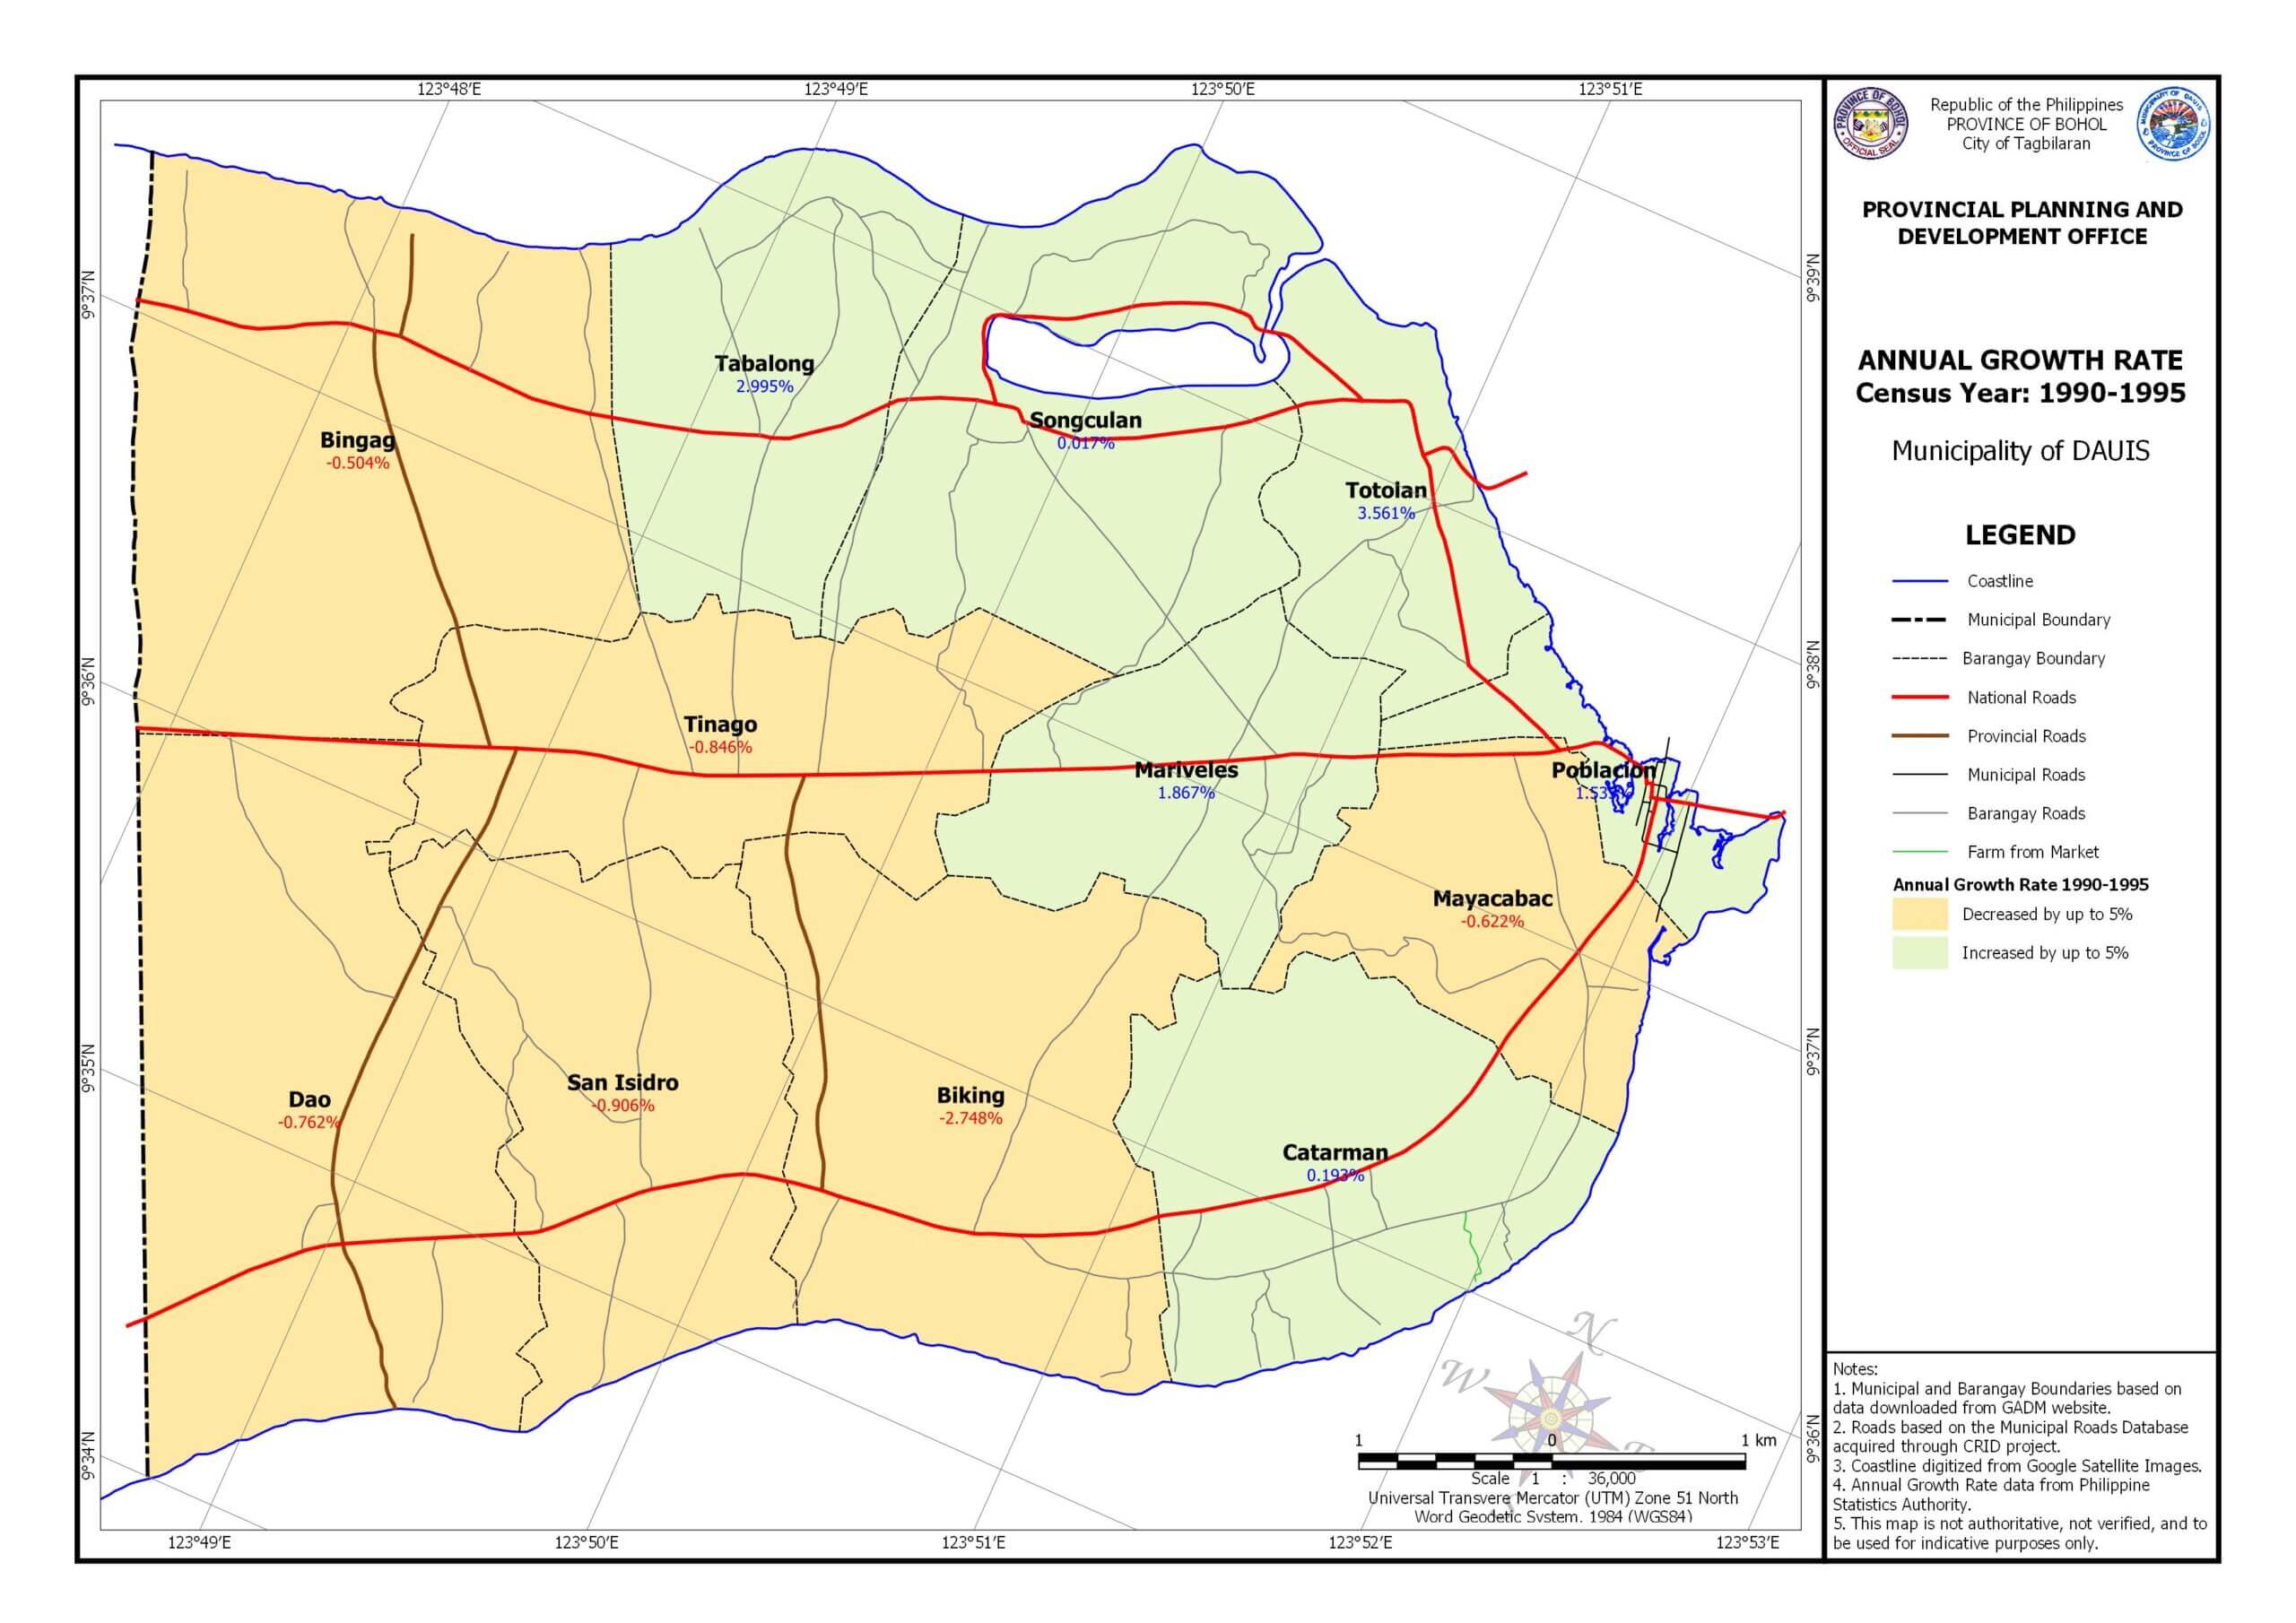
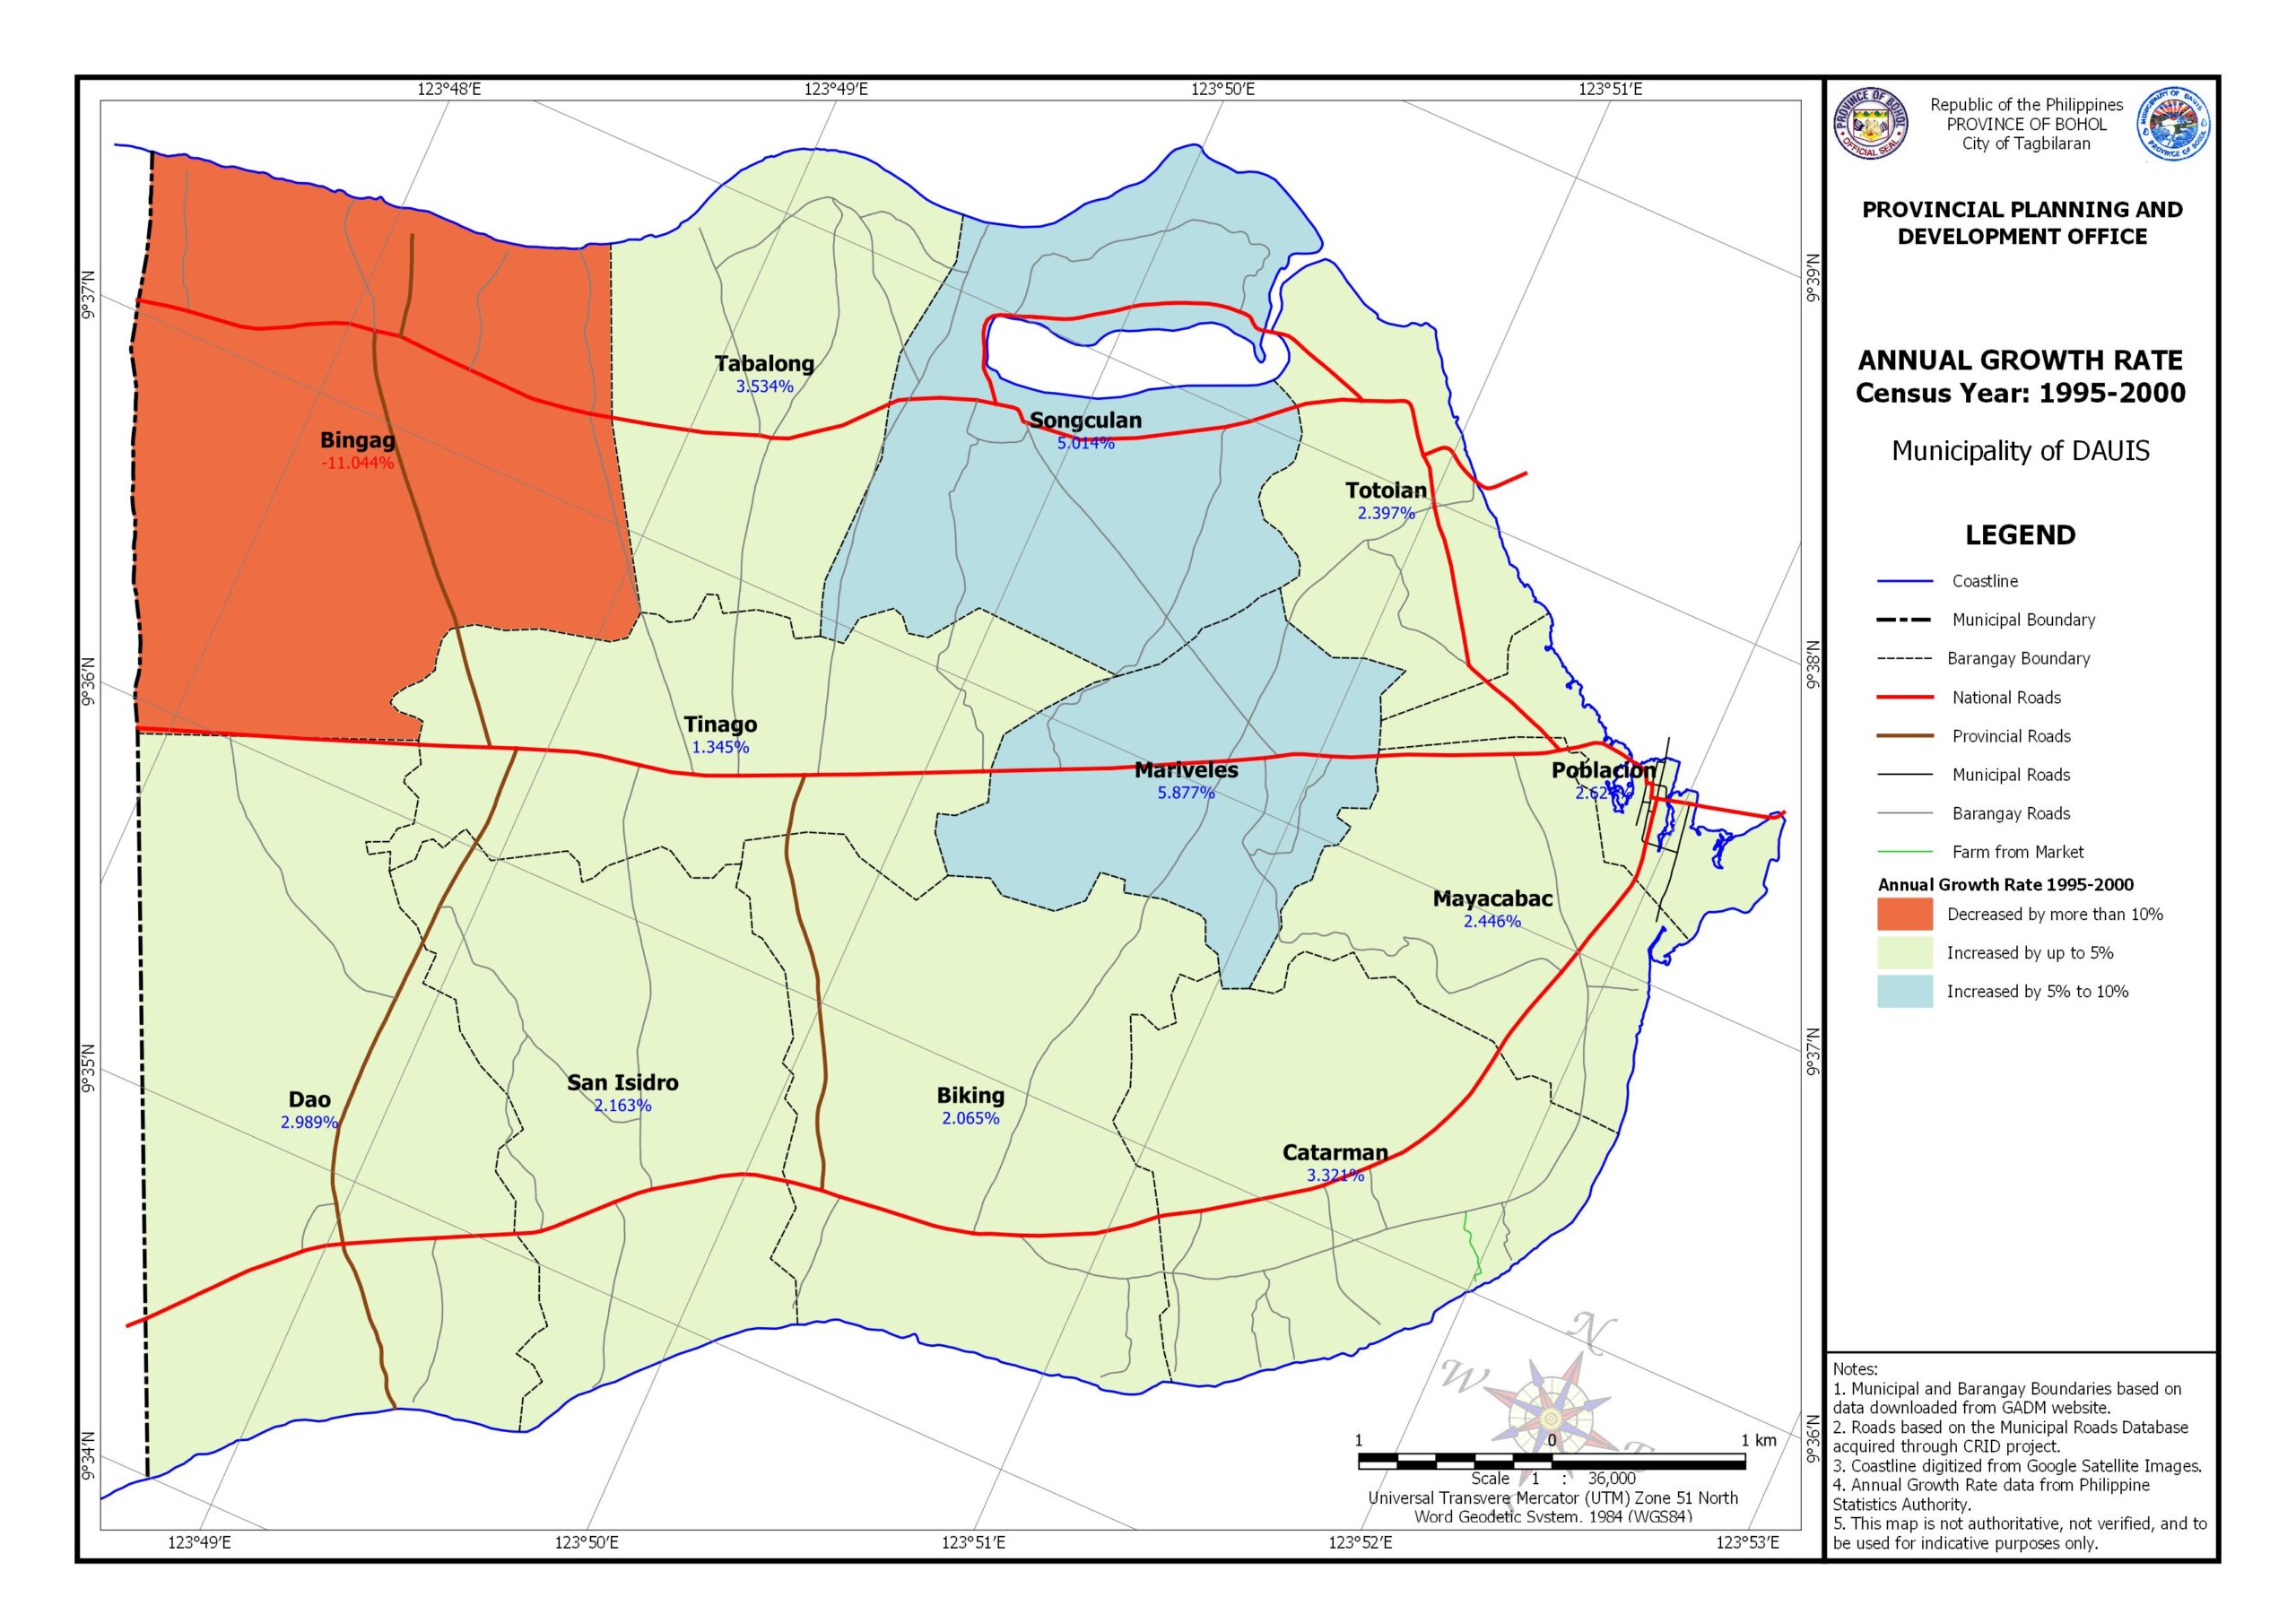
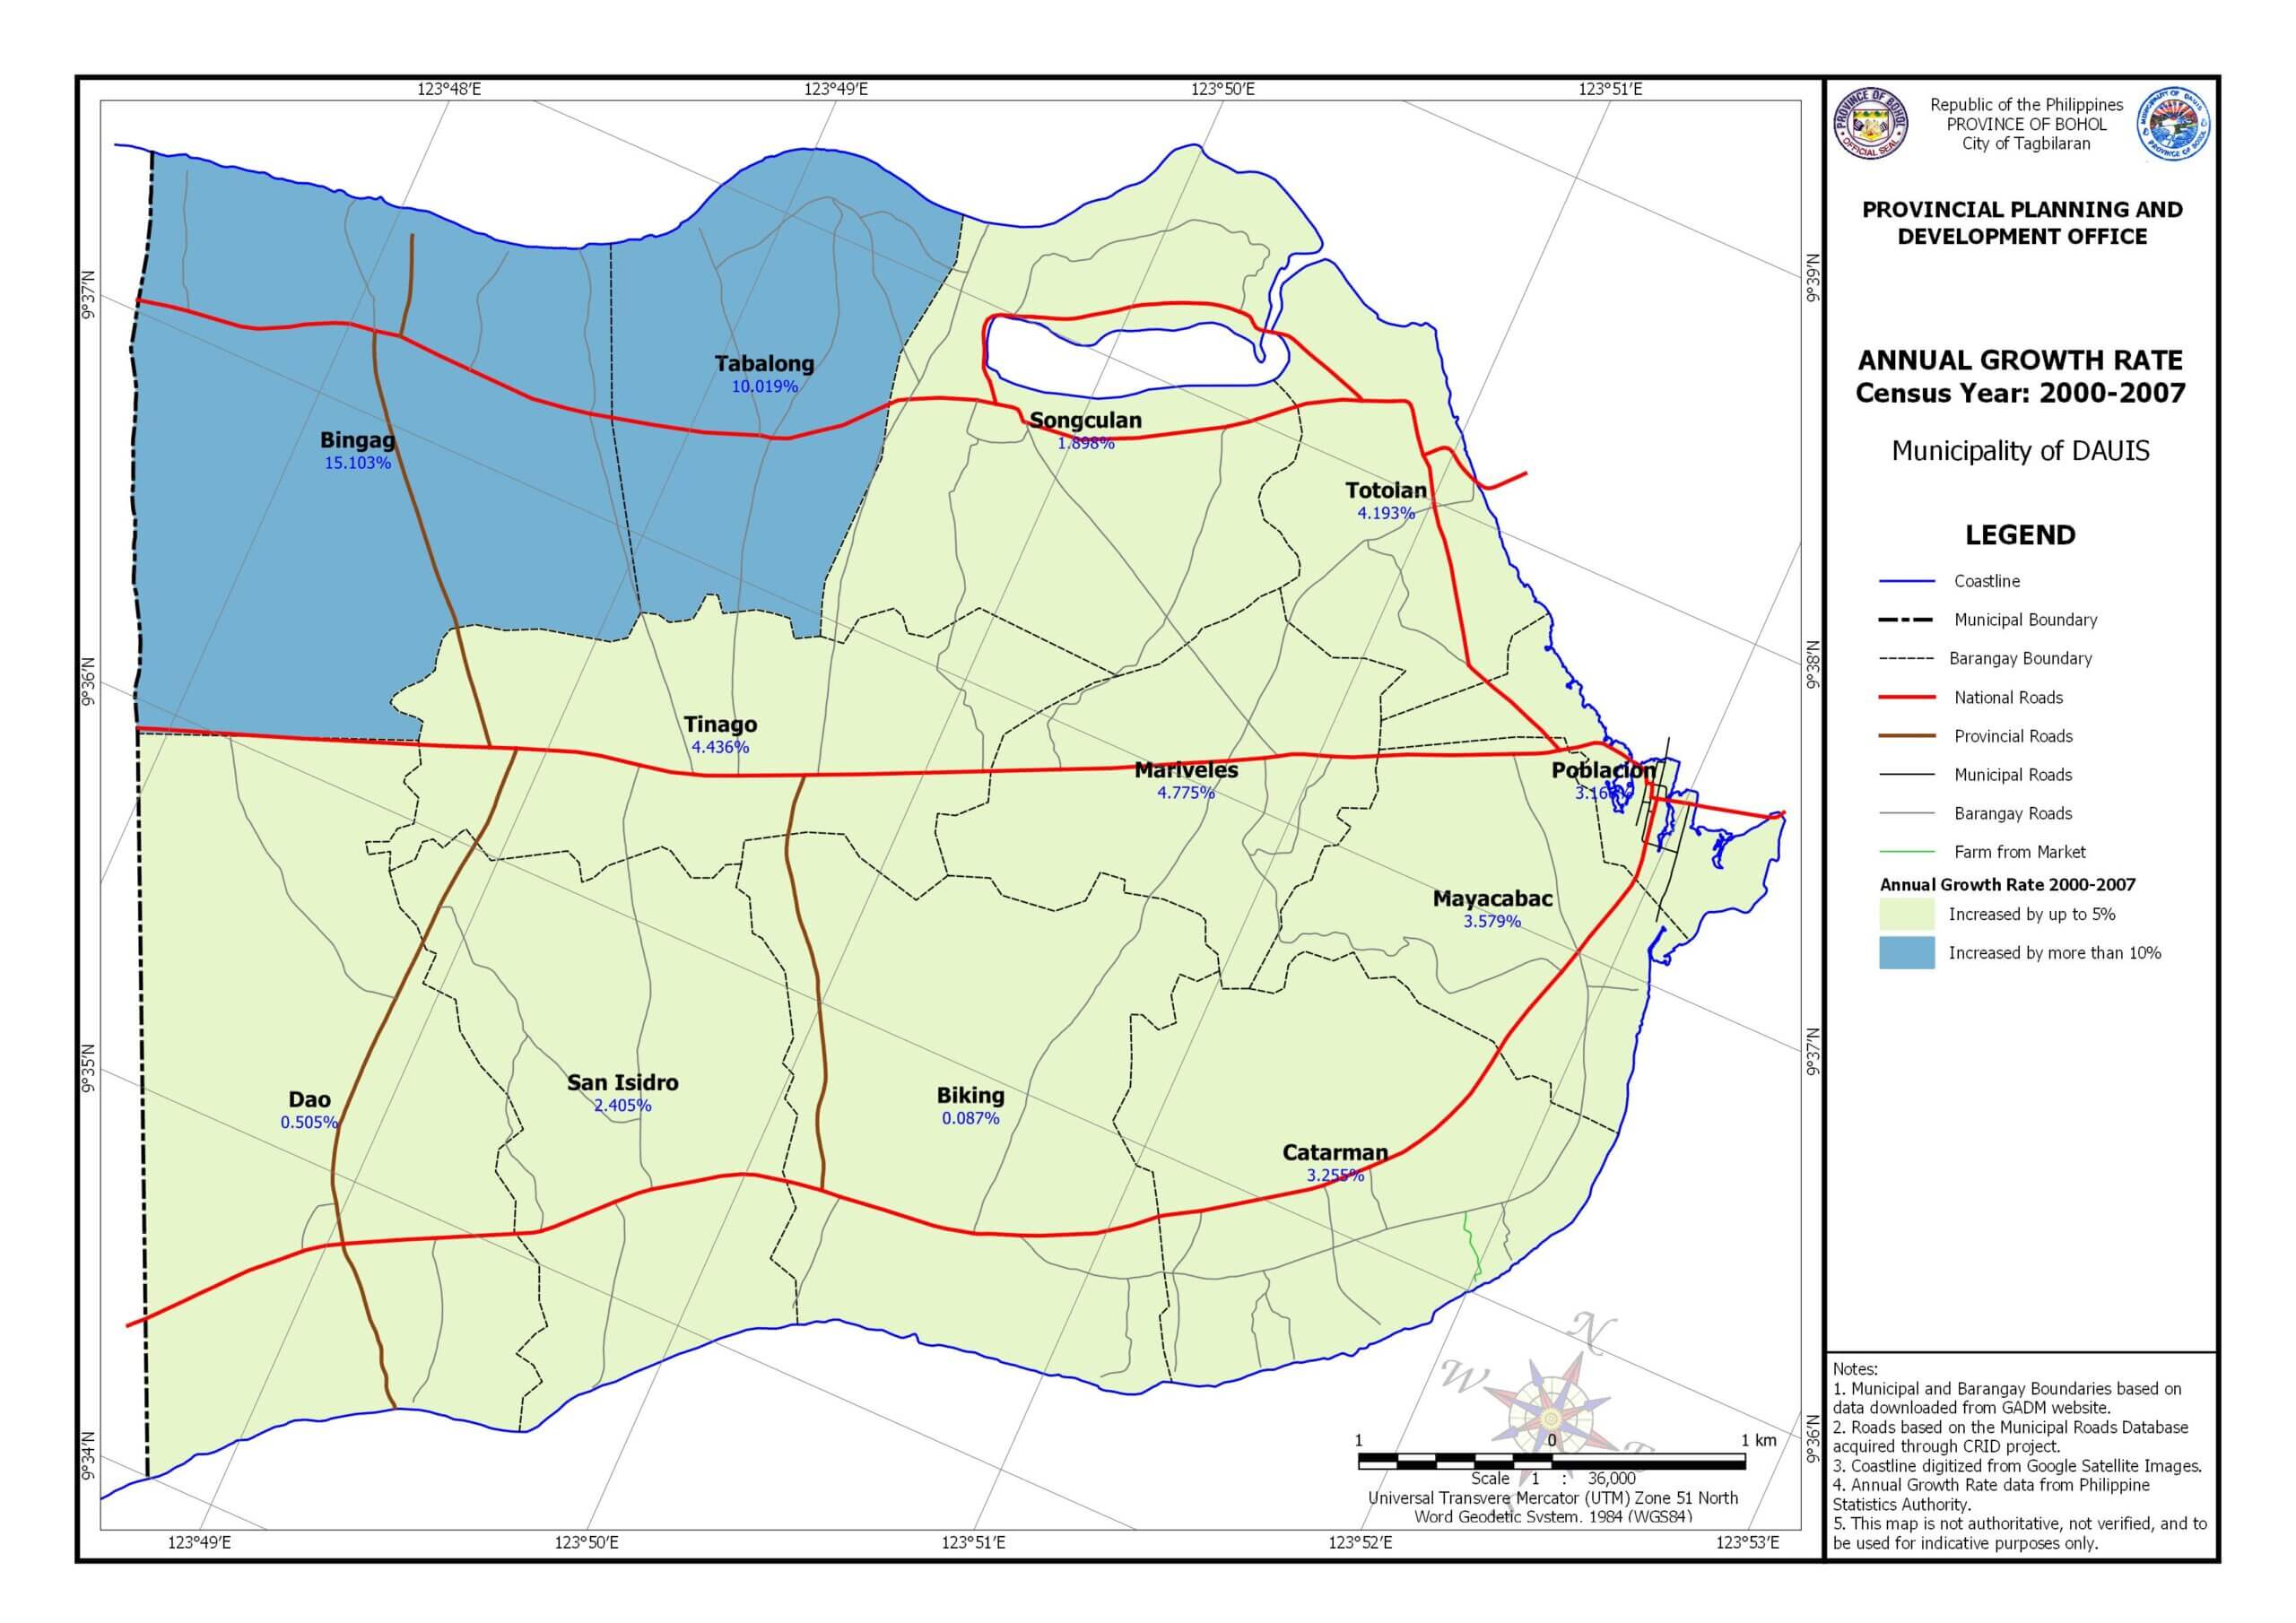
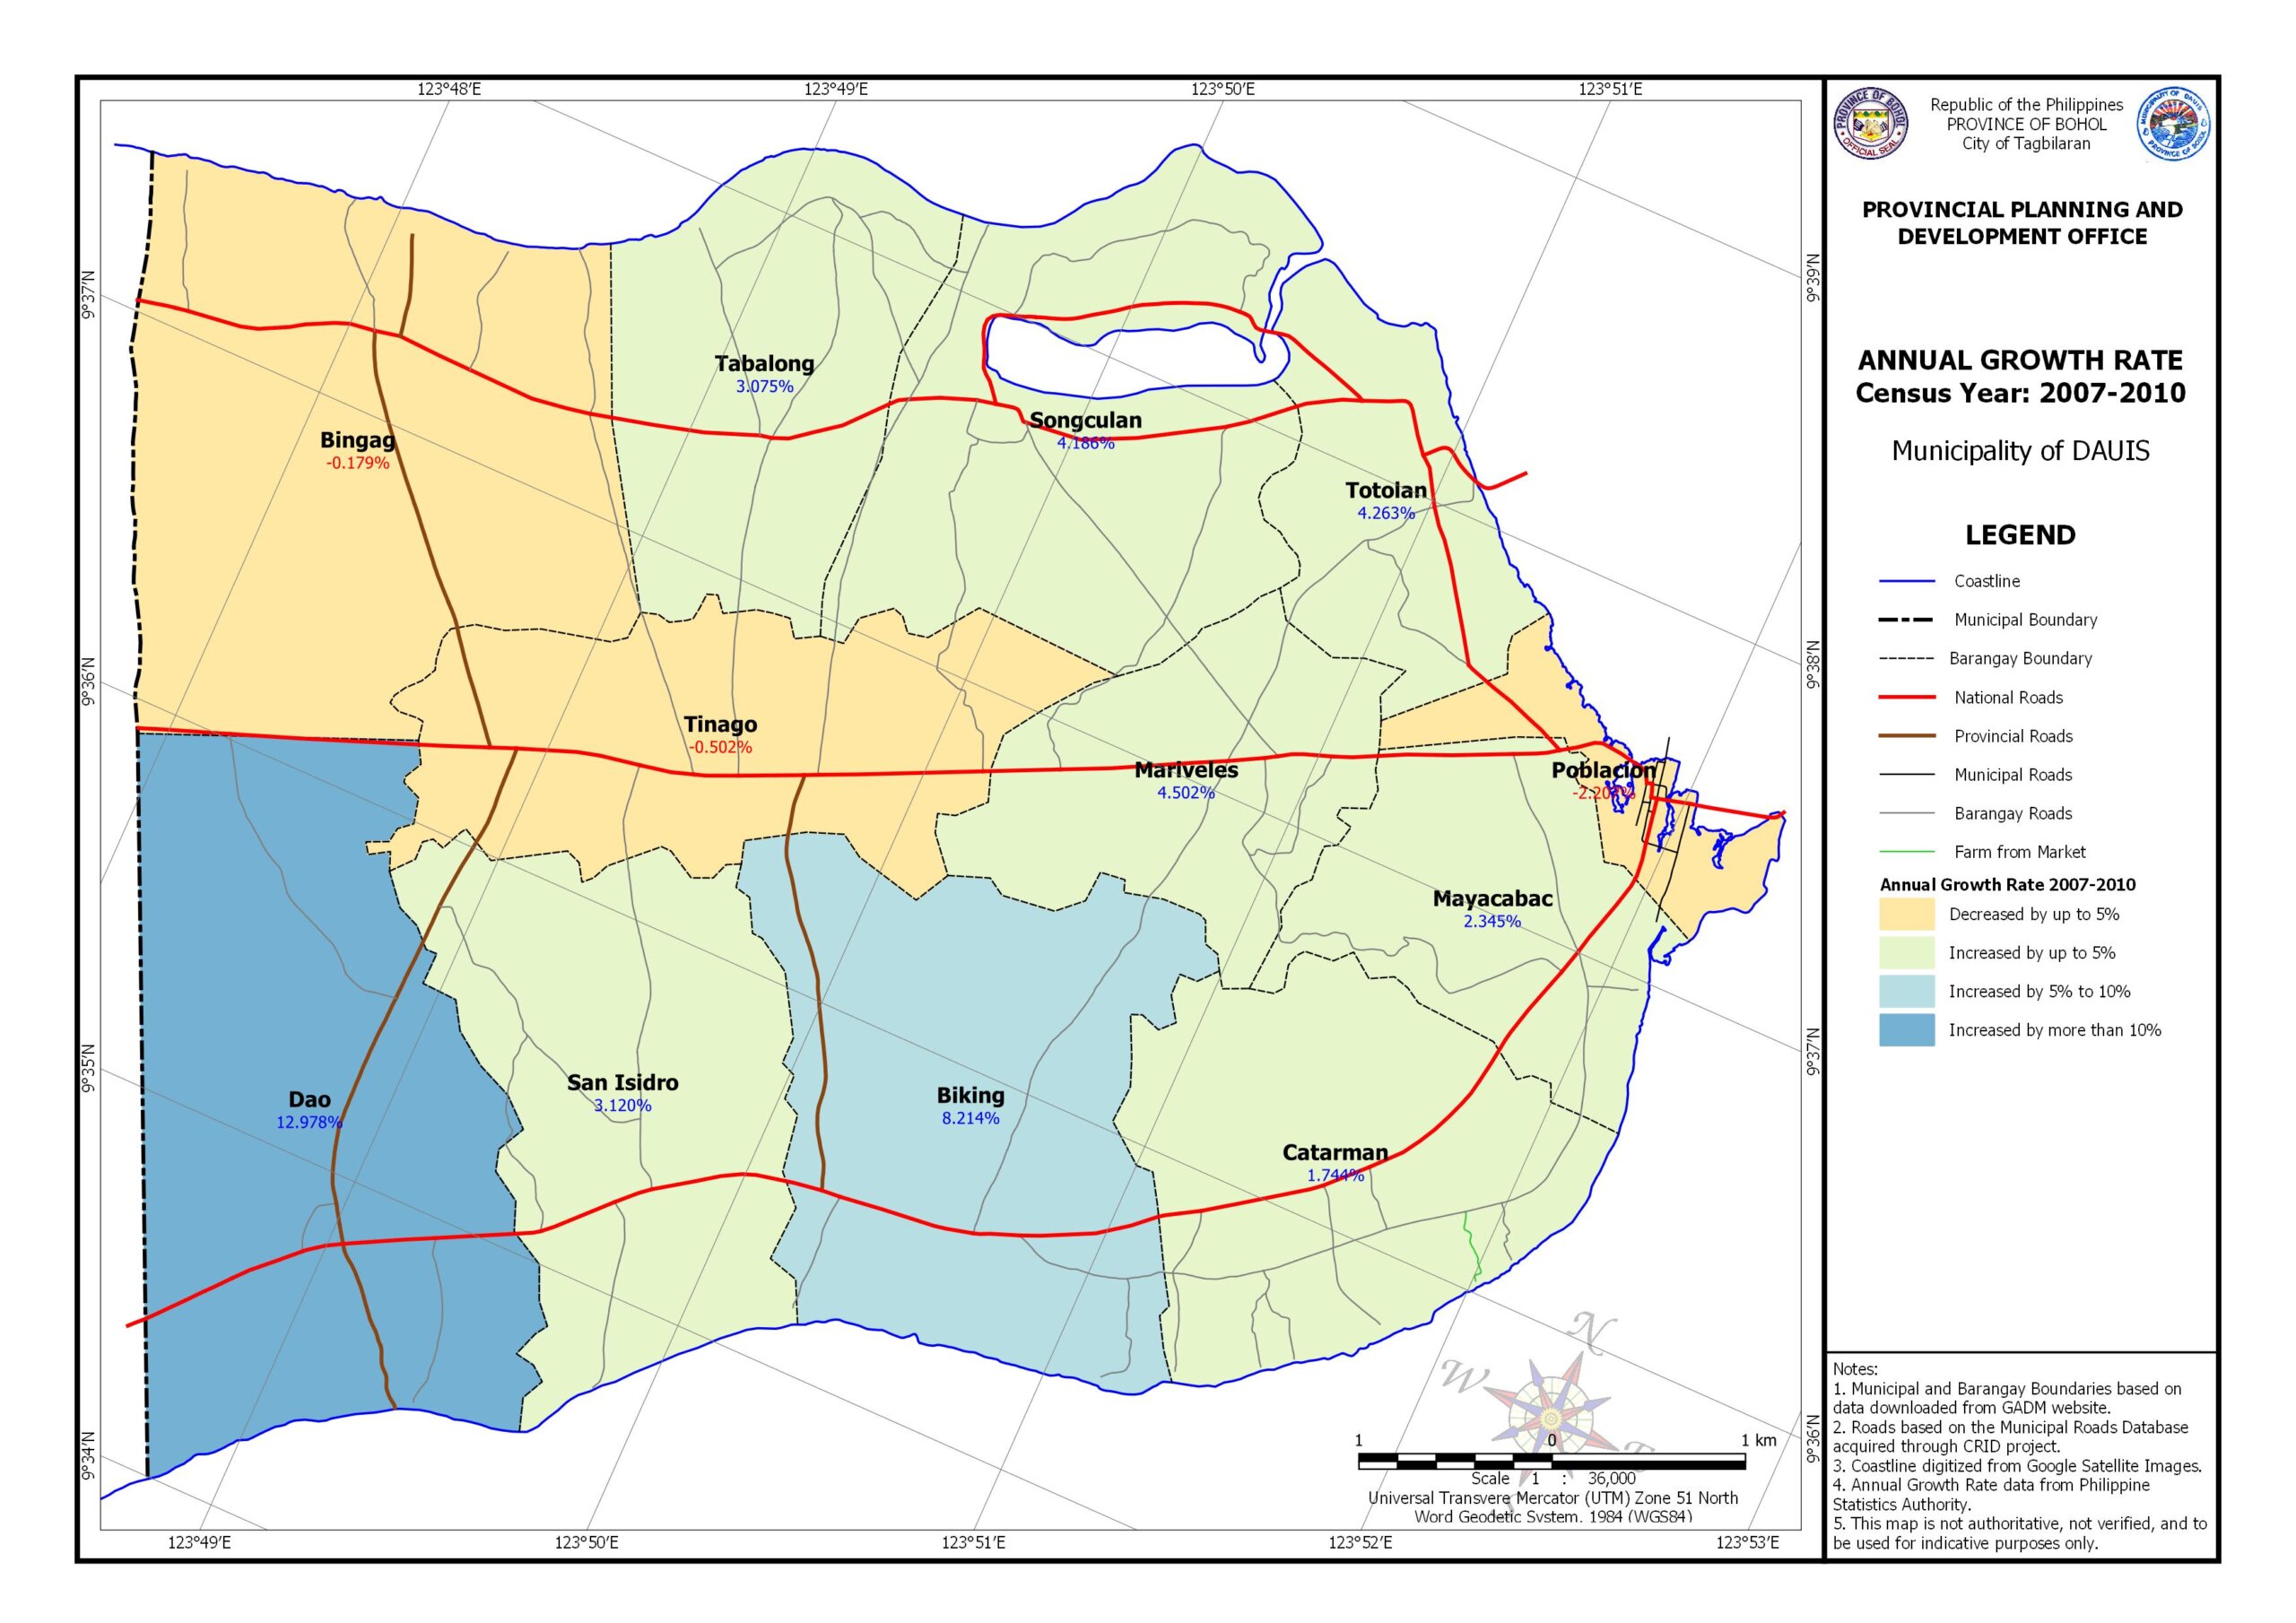
| Average Population Growth Rate | : | 4.42% (2007-2010 NSO) |
| Total Number of Households | : | 5,283 (CY2000) projected tobe 8,142 in 2010 |
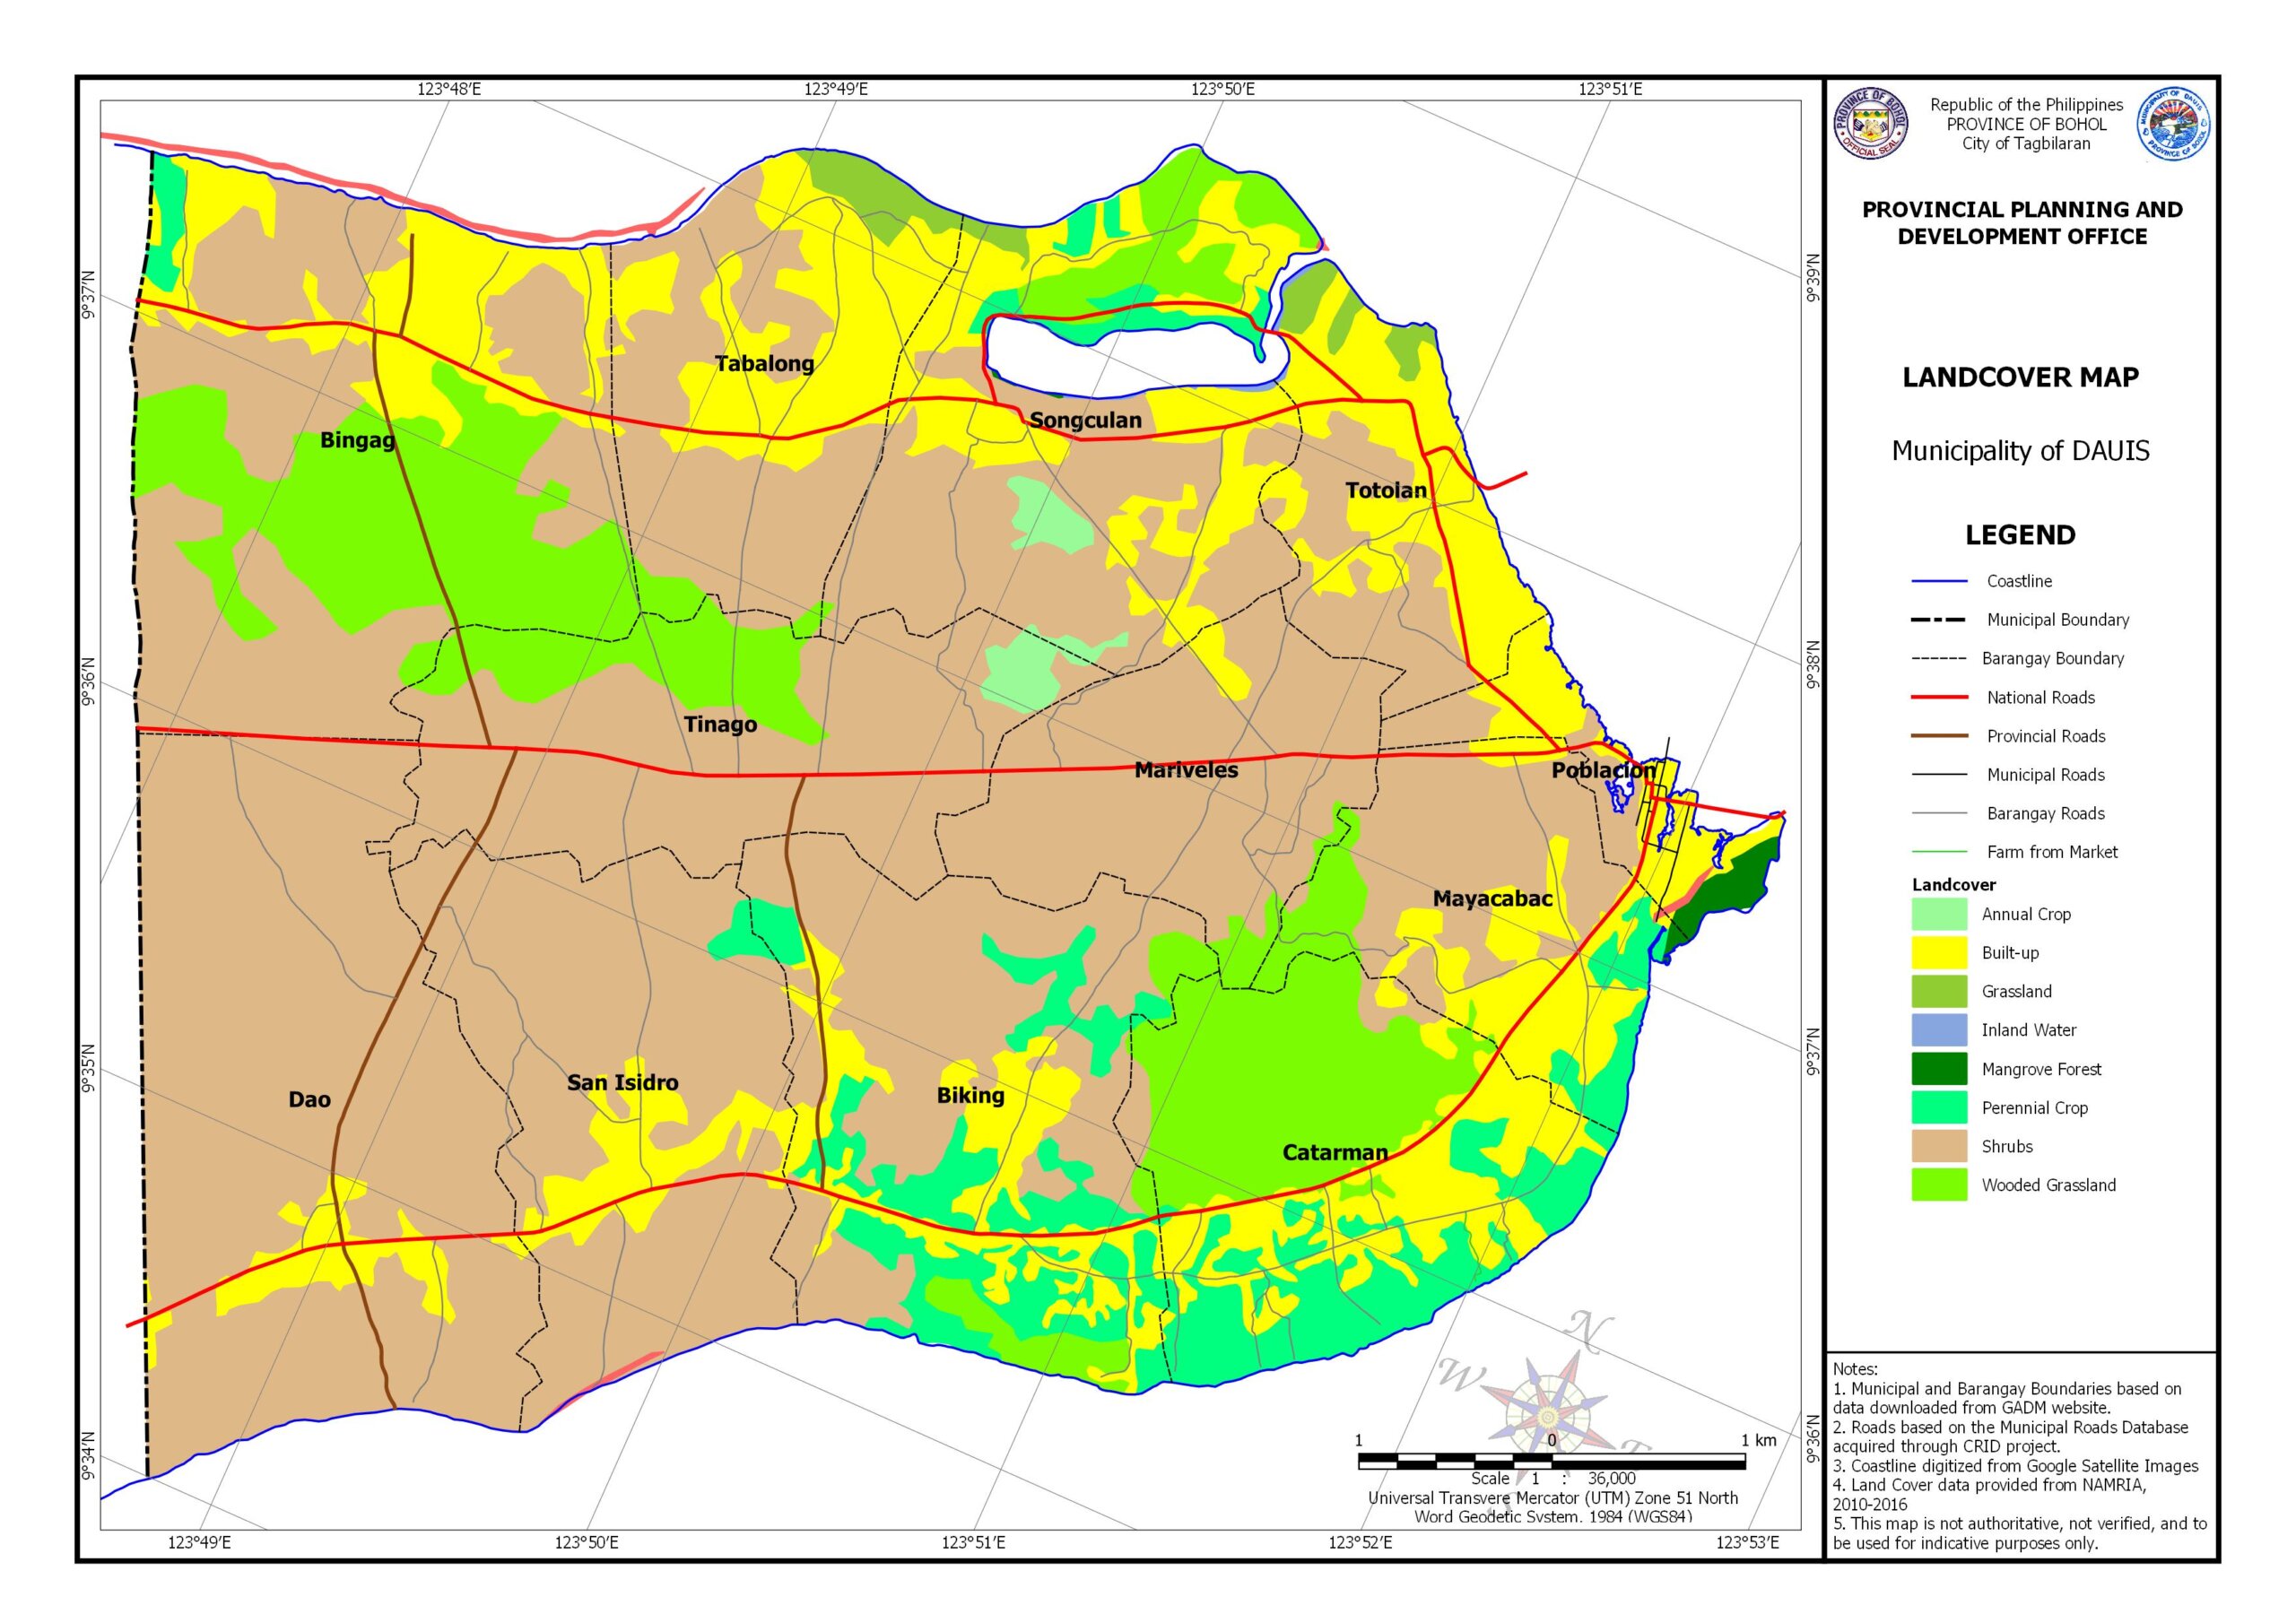
| Major Industries | : | Fishing, Farming |
| Literacy Rate | : | 93.55% (CY1990) |
| Higher Education Institutions | : | none |
| Number of Secondary Schools | : | 2 (Biking and Tabalong) |
| Number of Primary/Elementary Schools | : | |
| Language/Dialect | : | Boholano (Binisaya) |
| Religion/Religious Affiliation (1990) | : | 97% Roman Catholics (CY 2000) |
| Main source of potable water | : | Groundwater extraction |
| Water Supply | : | L1 facilities – 12 barangays served thru 82 water wells L2 systems – 4 barangays served L3 systems – 10 barangays served |
| Potable Water Demand | : | 3107 cubic meters per day (cum/d), CY 1998; 7,670 cu.m./d (CY 2030) |
| Estimated Groundwater Recharge | : | |
| Water Demand for Irrigation | : | None |
| Energization Status (as of CY 1999) | : | 12 (100%) Barangays Energized; 8,746 Total Number of HH Served; 100% HH Connections Served |
| No. of HH w/ accessed to Sanitary Toilets | : | 5,098 (CY 2000) |
| Drainage and Sewerage System | : | None |
| Number of Barangay Health Stations | : | 12 (100%) |
| Number of Hospital | : | None |
| Number of Municipal Health Center | : | 1 located in the Poblacion |
| Number of Day Care Centers | : | 11 (92%) |
| Carpable Areas | | None |
| Total Road Length | | 92.514 Kms. Total; (9.251National, 27.000 Provincial, 2.211 Municipal, 53.852 Barangay |
| Total Number of Bridges | | 2 (National and Provincial) |
| Communication System | | 1 Public Calling Office; 25 PLDT connections |
| Official Website | | www.dauis.bohol.gov.ph |